
This article is split into a nine part series to improve readability – this third installment in the series covers how to store event data into metrics indexes, which is useful for saving summarized and/or historical data for later analysis.
Parts 1-3 of this series cover what metrics indexes are and how to create and populate one:
- Comparing events and metrics indexes – they are a bit different.
- Creating metrics indexes – and how to store multiple measurements in each event.
- Storing event data into metrics indexes – great for saving measurements and trend history.
Parts 4-5 of the series will outline how to inspect and extract data from metrics indexes:
- Investigating metrics indexes – this is trickier than with events.
- Retrieving data from metrics indexes – this is too.
Parts 6-9 wrap up the series with examples of how to analyze data from metrics indexes and use it in visualizations, as well as some notes on naming conventions and troubleshooting:
- Analyzing metrics data – much the same as events data, but there are some twists.
- Visualizing metrics data – formatting the data correctly helps.
- Naming conventions for metrics and dimensions – structure is important
- Troubleshooting metrics indexes – what could go wrong?
tl;dr
“My simple definition and mental model of metrics indexes, based on a foundational understanding of events indexes, is that metrics indexes are designed to store numeric measurements in a highly efficient manner, and consist of events that contain just the four standard Splunk index fields: _time, source, sourcetype, and host, along with numeric measurements that are stored with a metric_name, and ‘dimension’s which are string fields that can be used for filtering and grouping the data sets.”
Storing event data into metrics indexes
There are a number of approaches and solutions for getting machine data into Splunk metrics indexes that are beyond the scope of this article. The discussion and examples below focus on extracting data from existing Splunk event type indexes and storing statistical data derived from these events into metrics indexes for later analysis and visualization. This is a good way to gain familiarity with metrics indexes, and the retrieval and visualization techniques covered in this article will apply regardless of where and how the metrics data originates.
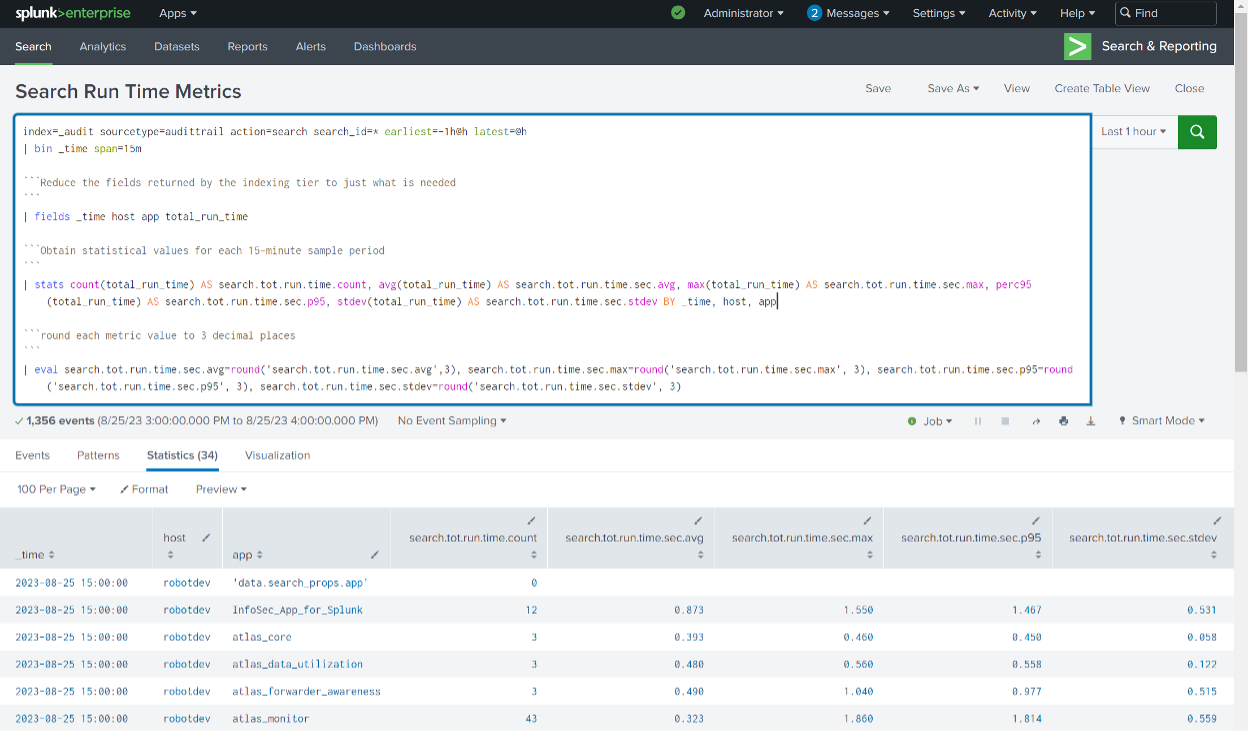
The following example illustrates a search against the Splunk internal _audit index to analyze run times for searches that occurred in the previous hour, in 15-minute increments, and include information about the Splunk app the search originated from in case you need help tracking down an excessive offender:
index=_audit sourcetype=audittrail action=search search_id=* earliest=-1h@h latest=@h
| bin _time span=15m
“`Reduce the fields returned by the indexing tier to just what is needed – improves performance
“`
| fields _time host app total_run_time
“`Obtain statistical values for each 15-minute sample period and create hierarchical metric names
“`
| stats count(total_run_time) AS search.tot.run.time.count, avg(total_run_time) AS search.tot.run.time.sec.avg, max(total_run_time) AS search.tot.run.time.sec.max, perc95(total_run_time) AS search.tot.run.time.sec.p95, stdev(total_run_time) AS search.tot.run.time.sec.stdev BY _time, host, app
“`round each metric value except count to 3 decimal places
“`
| eval search.tot.run.time.sec.avg=round(‘search.tot.run.time.sec.avg’,3), search.tot.run.time.sec.max=round(‘search.tot.run.time.sec.max’, 3), search.tot.run.time.sec.p95=round(‘search.tot.run.time.sec.p95’, 3), search.tot.run.time.sec.stdev=round(‘search.tot.run.time.sec.stdev’, 3)
“`ensure each metric has some numeric value
“`
| fillnull value=0
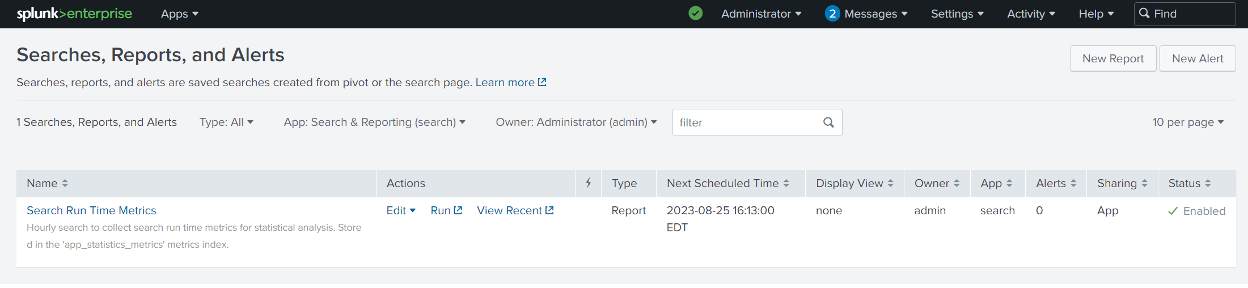
The results include a search count and the average, peak, 95th percentile, and standard deviation metrics for each 15-minute period. This search can be saved as a Report with ‘Save As’ > Report – this one is named ‘Search Run Time Metrics’:
The search is then scheduled to run in a less-busy period after the top of each hour by clicking Edit > Edit Schedule and using a cron timer such as ’13 * * * *’
There are two approaches to getting this statistical data derived from event logs into a metrics index. You can apply the mcollect or meventcollect command as the last line of the Search Processing Language (SPL), with the appropriate syntax and arguments, or you can let Splunk do it.
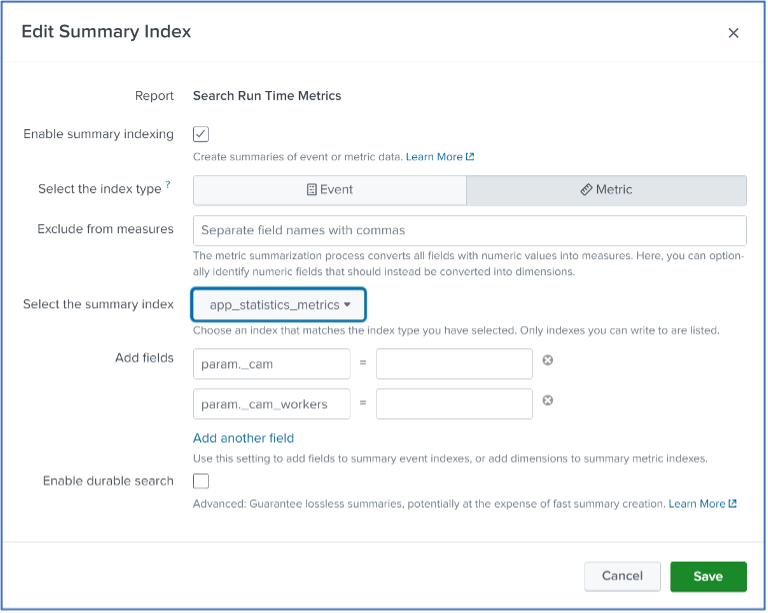
The easier and more educational approach, at least to get started, is to allow Splunk to configure a mcollect command for you by finding your report in ‘Searches, Reports, and Alerts’ and selecting Edit > Edit Summary Indexing. Click the ‘Enable summary indexing’ checkbox, then select the appropriate metrics index from the ‘Select the summary index’ drop-down, and click ‘Save’.
After the scheduled search has run at least once, click ‘View Recent’ and then click the latest run entry. You will see the SPL and search results – and note that a mcollect entry has been added as a last line in the SPL by Splunk as a result of configuring the Summary Indexing in the step above:
| mcollect spool=t index=”app_statistics_metrics” file=”RMD5680f66cdd0d29571_464585425.stash_new” name=”Search Run Time Metrics” marker=”” split=allnums
The arguments to the mcollect command in the above example are as follows:
| mcollect – the mcollect command converts events into data points to be stored in a metrics index.
Basically, the mcollect command with the arguments above collects the search results into a unique file created in the $SPLUNK_HOME/var/spool/splunk directory on the search head, where it is indexed and then deleted.
Note: An alternative is the meventcollect command, which converts events generated by streaming search commands into metric data points and stores that data into a metrics index on the indexers. Put another way – meventcollect can be used to save non-transformed data from events into metrics indexes. If you ‘transform’ the data by converting it into a row/column table format with a stats or table command, you’ll need to use mcollect to store it in a metrics index. See the Splunk docs for details: https://docs.splunk.com/Documentation/Splunk/9.1.0/SearchReference/Meventcollect
spool=t If set to true, the metrics data file is written to the Splunk spool directory ($SPLUNK_HOME/var/spool/splunk) for ingestion and deletion. If set to false, the file is written to the $SPLUNK_HOME/var/run/splunk directory, and the file will remain in this directory unless further automation or administration is done to remove it.
file=”RMD5680f66cdd0d29571_464585425.stash_new” The file name where you want the collected metric data to be written. The filename in this example was created by Splunk from using the Summary Indexing option, but you can specify a filename if you manually configure the mcollect command. You can also use a timestamp or a random number for the file name by specifying either file=$timestamp$ or file=$random$.
name=”Search Run Time Metrics” This argument isn’t specified in the Splunk docs but appears to behave like an alias for the ‘marker’ argument discussed below.
marker=”” Unused in this example. The syntax for this argument is: marker=<string>
The marker argument string can be one or more comma-separated key/value pairs that mcollect adds as dimensions to metric data points it generates, to ease searching on those metric data points later. An example of using this argument is: marker=dataset=search_run_time_statistics. You could then use ‘dataset=search_run_time_statistics’ as a filter in your search to extract just those metrics events.
split=allnums The syntax for this argument is: split=<true | false | allnums>
When set to ‘allnums’, mcollect treats all numeric fields as metric measures and all non-numeric fields as dimensions. This eliminates having to specify these, but you can optionally use a ‘field-list’ argument to declare that mcollect should treat certain numeric fields in the events as dimensions.
You can review the syntax, usage, and additional information about mcollect arguments in the Splunk docs: https://docs.splunk.com/Documentation/Splunk/latest/SearchReference/Mcollect
Final Notes on mcollect
If you inspect the savedsearches.conf file that contains a scheduled search that includes Splunk Web configured Summary Indexing, you will NOT find the mcollect command entries there. They are the result of an ‘action.summary_metric_index.comand’ function with control syntax which can be found in the Edit > Advanced Edit fields for your saved search.
However, once you understand how to use the mcollect command and its arguments, you can add it to the bottom of your saved-search SPL and forgo using the Summary Index option altogether to provide better control over how the data is indexed.
Conclusion
In this segment, we covered how to use the mcollect command to save data extracted from event logs into a metrics index. Part 4-5 of this series will outline how to inspect and become familiar with metrics indexes, and how to extract data from them – see you there!
Don’t miss out on part one and part two of our series on Splunk Metrics Indexes!
If you found this helpful…
You don’t have to master Splunk by yourself in order to get the most value out of it. Small, day-to-day optimizations of your environment can make all the difference in how you understand and use the data in your Splunk environment to manage all the work on your plate.
Cue Atlas Assessment: Instantly see where your Splunk environment is excelling and opportunities for improvement. From download to results, the whole process takes less than 30 minutes using the button below:


