
This topic is split into a nine-part series to improve readability – this is the fourth installment which covers investigating Splunk metrics indexes.
Parts 1-3 of this series cover what metrics indexes are and how to create and populate one:
- Comparing events and metrics indexes – they are a bit different.
- Creating metrics indexes – and how to store multiple measurements in each event.
- Storing event data into metrics indexes – great for saving measurements and trend history.
Parts 4-5 of the series will outline how to inspect and extract data from metrics indexes:
- Investigating metrics indexes – this is trickier than with events.
- Retrieving data from metrics indexes – this is too.
Parts 6-9 wrap up the series with examples of how to analyze data from metrics indexes and use it in visualizations, as well as some notes on naming conventions and troubleshooting:
- Analyzing metrics data – much the same as events data, but there are some twists.
- Visualizing metrics data – formatting the data correctly helps.
- Naming conventions for metrics and dimensions – structure is important
- Troubleshooting metrics indexes – what could go wrong?
“My simple definition and mental model of metrics indexes, based on a foundational understanding of events indexes, is that metrics indexes are designed to store numeric measurements in a highly efficient manner, and consist of events that contain just the four standard Splunk index fields: _time, source, sourcetype, and host, along with numeric measurements that are stored with a metric_name, and ‘dimension’s which are string fields that can be used for filtering and grouping the data sets.”
Investigating Metric Indexes
Once you have data stored in a metrics index, you’ll obviously want to use it for operational or security monitoring, alerting, and visualizations. And if you are building these solutions, you’ll want to search and inspect the content and format of the metrics data so you know what you have to work with.
The format of the data stored in metrics indexes is different than with events indexes, so the commands for retrieving that data differ as well. Splunk provides a number of specific utilities for extracting metrics data, and many of the search commands that work with events data will not work with metrics data.
All of the metrics-specific commands start with the letter ‘m’, must follow a pipe (‘|’) character, and must be the first line in a SPL series (in most cases). The following examples should be helpful, and you can get more detail from the Splunk docs – search the Internet for ‘splunk <command> command spec’.
mpreview
We’ll start with the mpreview command, since it allows viewing individual metrics events in similar fashion as you’re accustomed to doing with events indexes, provides a decent mental bridge from events to metrics convention, and can be used to get an idea of the kinds of fields and data points that are stored in your metrics indexes or for troubleshooting your metrics data and sources:
| mpreview target_per_timeseries=0 index=app_statistics_metrics
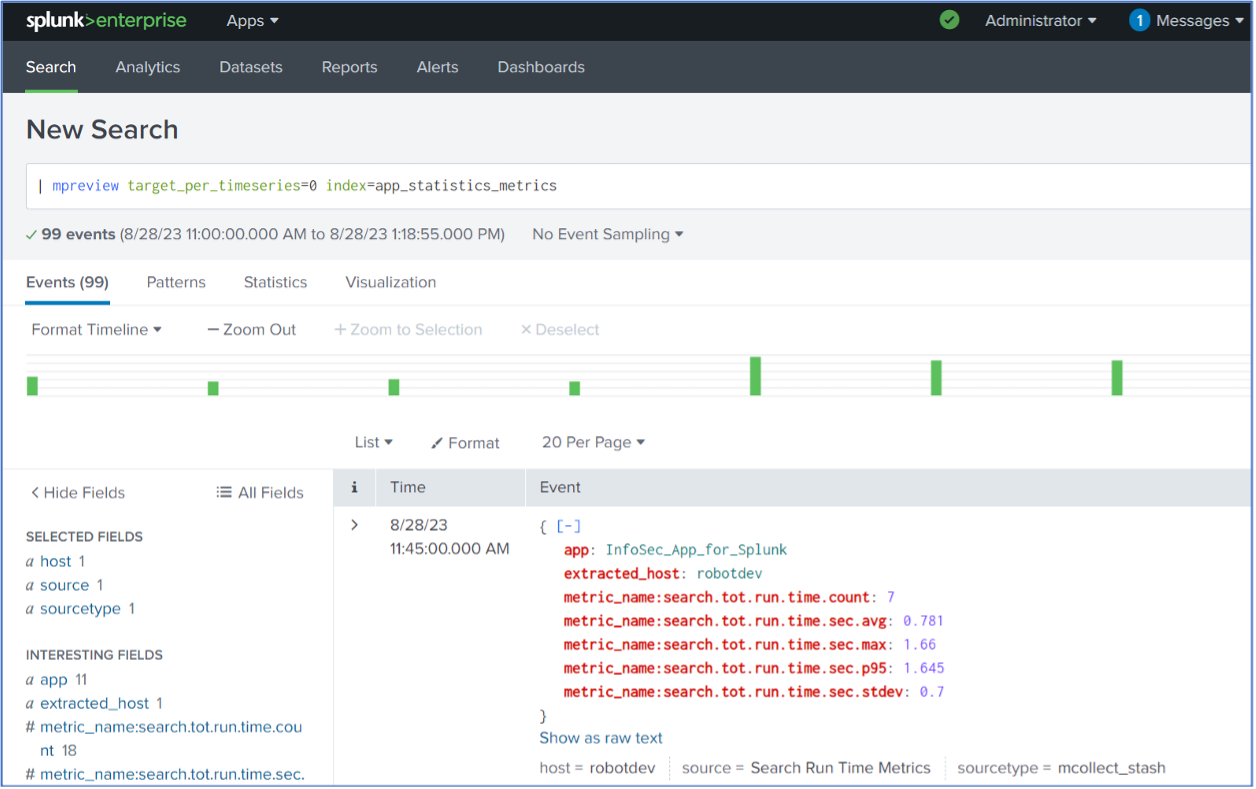
There are several items of note in the above results:
- The ‘target_per_timeseries=0’ argument to the mpreview command is used to specify the number of metric data points to retrieve per metric time series. Setting this argument to zero retrieves all of the data points, instead of the default of 5, which is useful for small investigative searches such as the above but is not a good idea with high volume data sources.
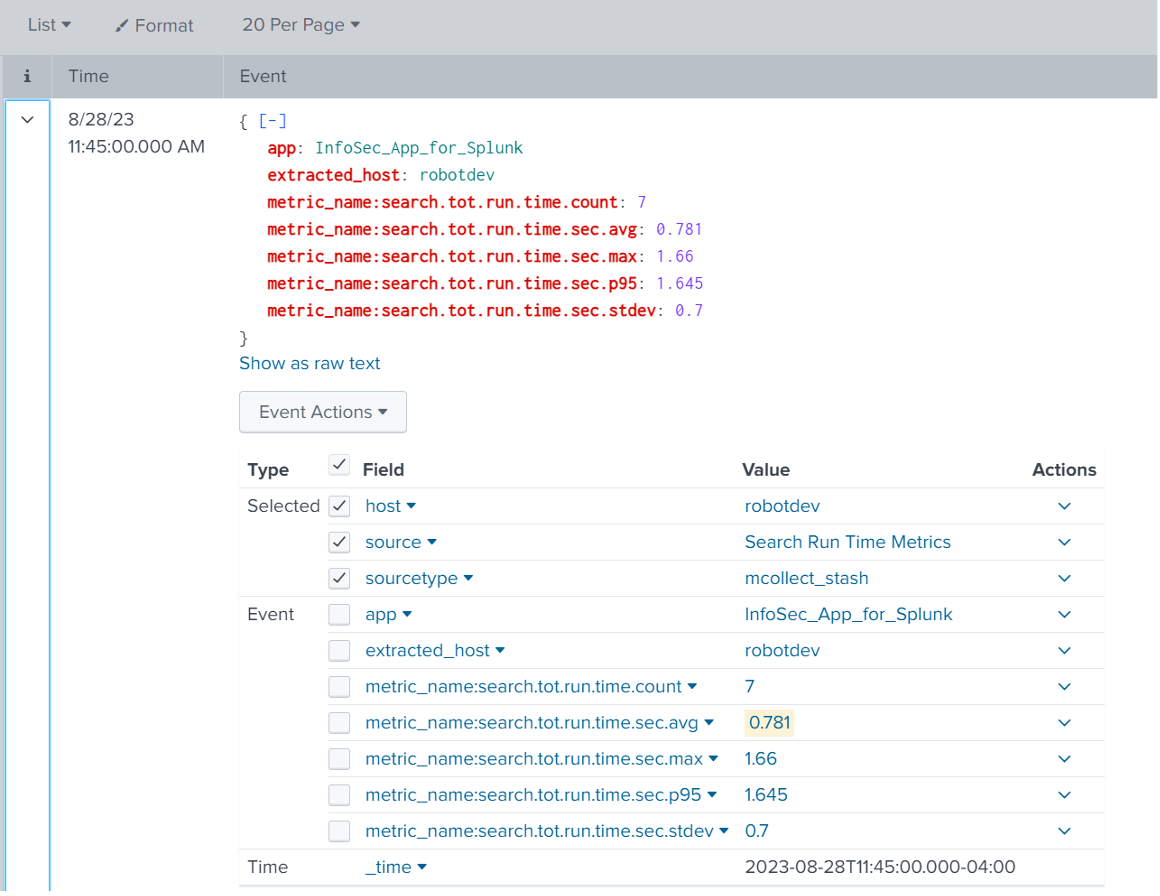
- Clicking the down arrow next to an event (in List view) reveals all of the fields contained in that event (as seen above). The standard host, source, sourcetype, and _time fields are present, along with the app and extracted_host dimensions and the metrics names and numeric values.
Once you see and become familiar with the fact that metrics events are just a few standard fields, one or more metric_name measurements, and a handful of dimensions it gets easier.
- A dimension prefixed with ‘extracted_’ indicates that the field name conflicted with a standard Splunk field name. For example, in this case the ‘host’ field is labeled ‘extracted_host’. You can avoid this by renaming the field – for example: | rename host AS hostname.
- Numeric measurement fields have a ‘metric_name:’ prefix + the field name.
- Dimension names with dot-syntax will be converted to underscores – Ex: run.time.group would become run_time_group.
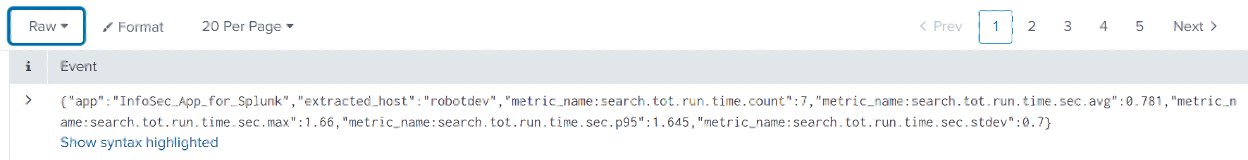
Data retrieved from a metrics index is presented as JSON for viewing in raw format in Splunk Web. You can see this by selecting ‘Raw’ from the drop-down above the events table – example below:
mcatalog
The mcatalog command displays the metric_names and dimensions in metric indexes. Examples of using the mcatalog command against our ‘app_statistics_metrics’ index are as follows:
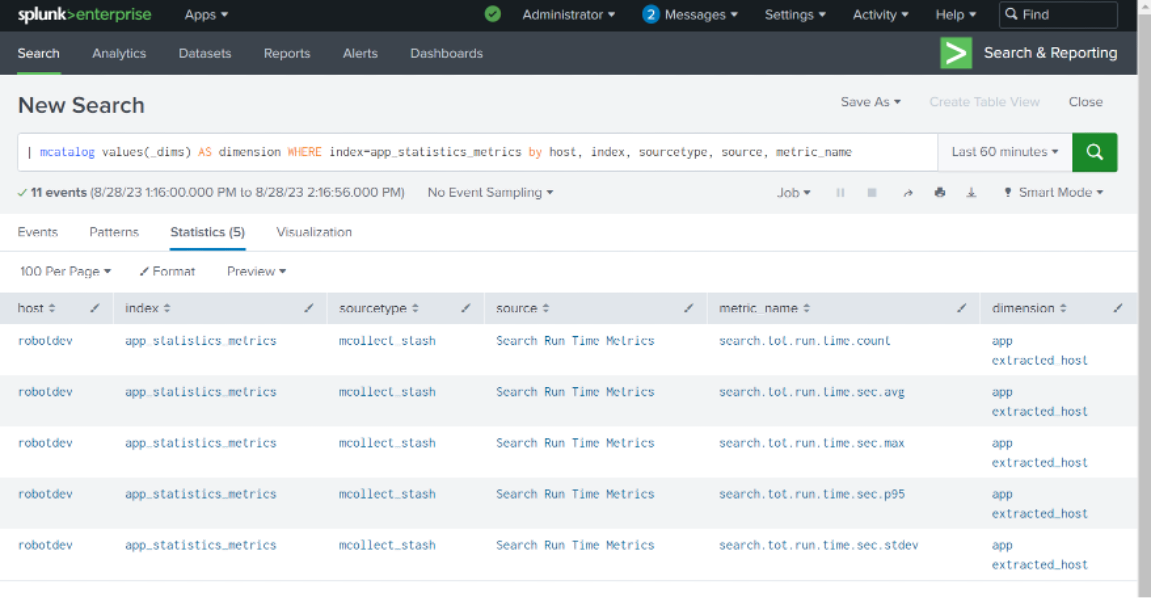
| mcatalog values(_dims) AS dimension WHERE index=app_statistics_metrics by host, index, sourcetype, source, metric_name
The results display all of the metric_names and the dimensions for those metrics across the app_statistics_metrics index:
A shortened version is:
| mcatalog values(_dims) AS dimensions WHERE index=app_statistics_metrics
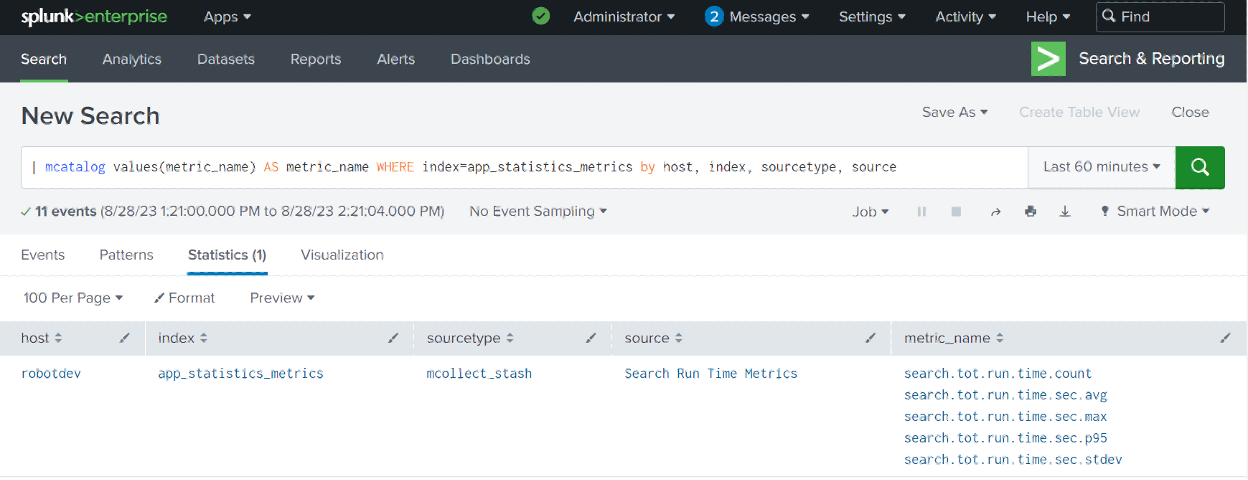
You can also use mcatalog to display just the metric_names for a given metrics index:
| mcatalog values(metric_name) AS metric_name WHERE index=app_statistics_metrics by host, index, sourcetype, source
mstats
The mstats command is used to aggregate and analyze metrics – you will use this a lot. This command can perform statistical summarization on the measurement (_value), metric_name, and dimension fields in metric indexes. You can use mstats in both historical searches and real-time searches; when used in a real-time search with a time window, a historical search runs first to backfill the data.
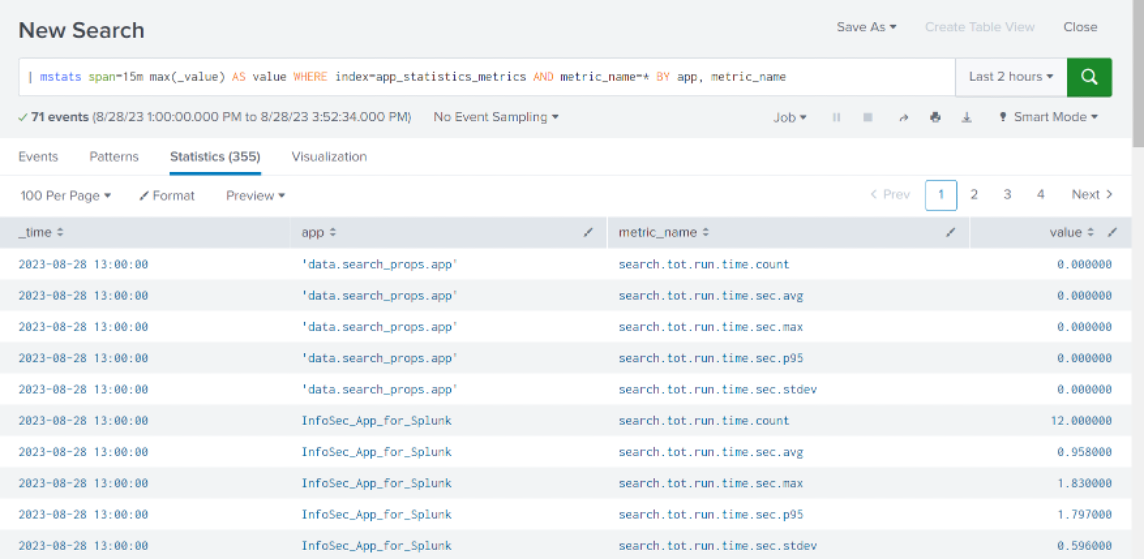
The mstats command has quite a few optional arguments, and several are required – here’s a minimum syntax example that includes an optional span argument applied to the app_statistics_metrics index:
| mstats span=15m max(_value) AS value WHERE index=app_statistics_metrics AND metric_name=* BY app, metric_name
And the results:
Let’s walk through the mstats command syntax and significant arguments.
| mstats span=15m max(_value) AS value WHERE index=app_statistics_metrics AND metric_name=* BY app, metric_name
| mstats – aggregation command for metrics index data points.
span=15m – bin the data points into 15-minute buckets. Since the data was binned into 15-minute samples in the search that extracted the data from the _audit event index and stored it in our metrics index, this allows retrieval in the same increments.
Alternatively, you can summarize multiple samples by expanding the span timeframe, remembering that you’ll apply the max, avg, etc. function across all of the values in a given time range bucket. You’ll want to think through and experiment with the statistical function you apply to your data samples to make sure you’re getting the results you expected.
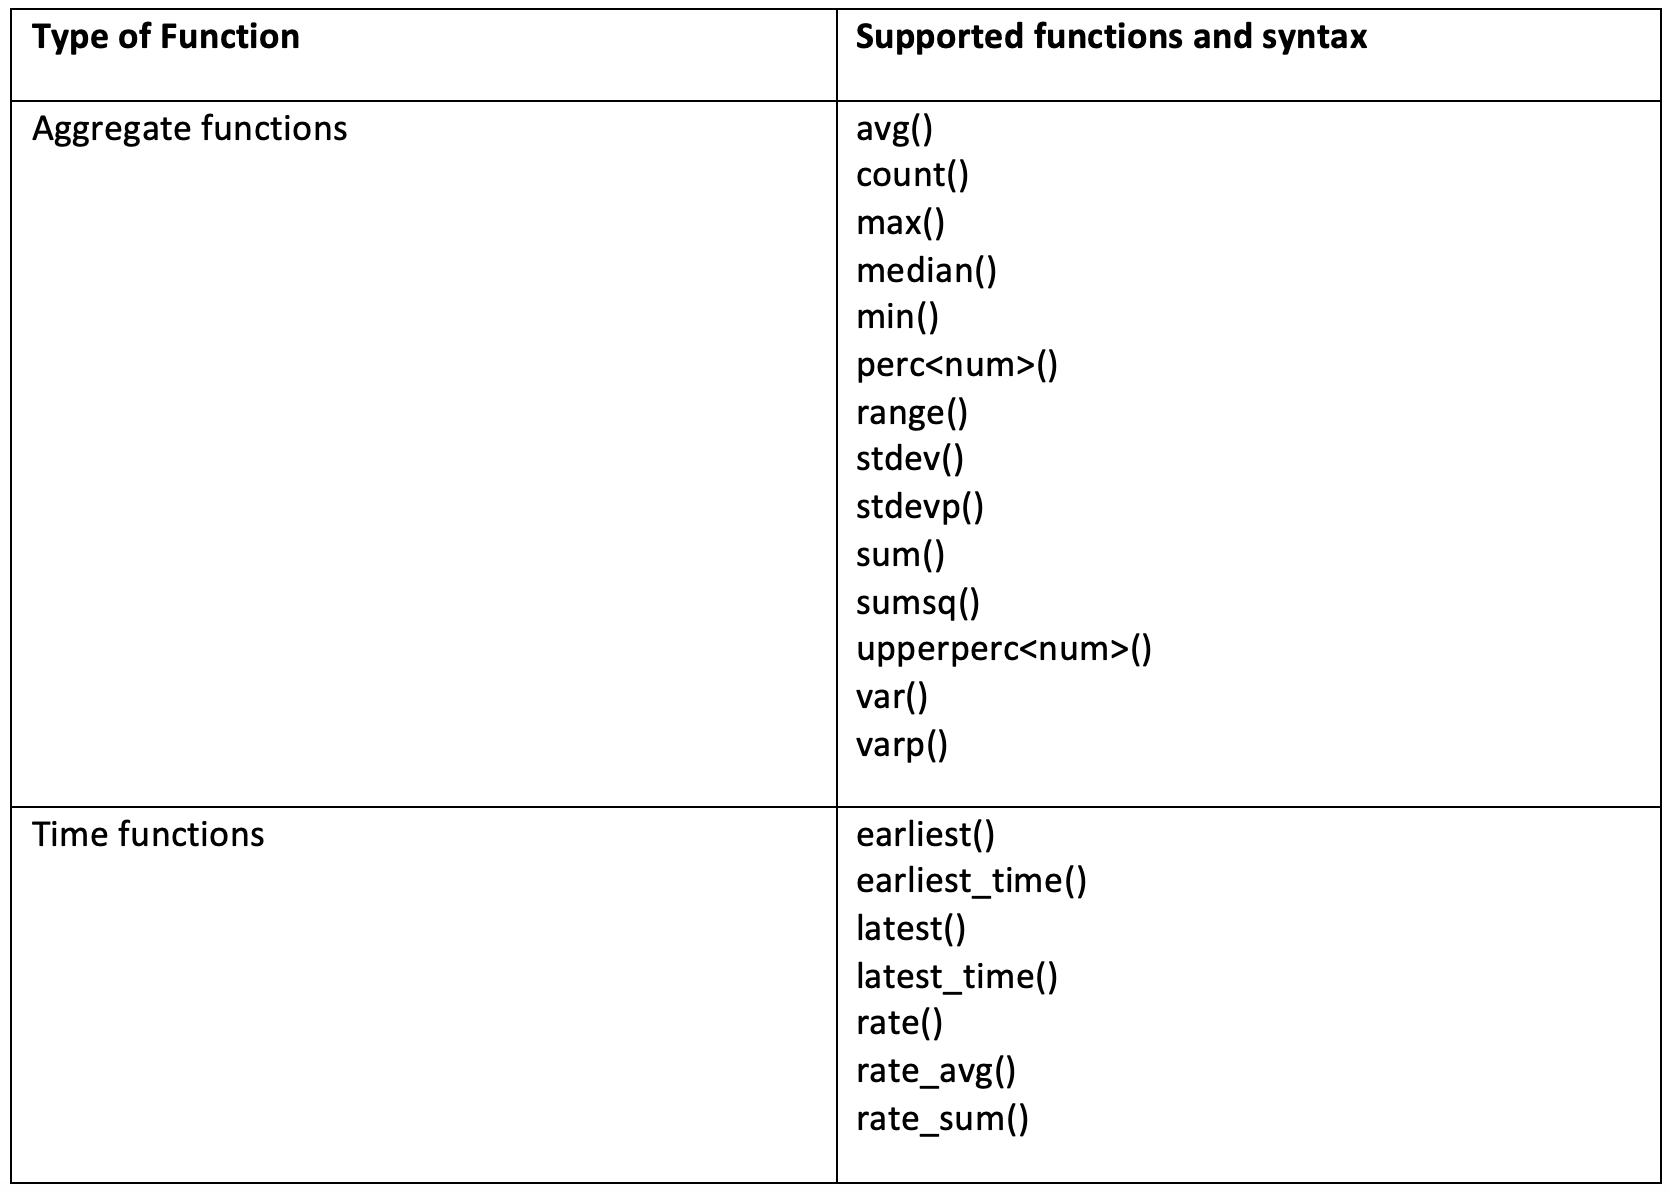
max(_value) AS value – apply an aggregating statistical function (max, avg, min, max, perc95, etc.) to the values of a set of data points in each metric_name, and rename the result field to ‘value’ instead of ‘max(_value)’. mstats supports many of the same functions as the ‘stats’ command – see the docs and the table below.
WHERE index=app_statistics_metrics – specify the index.
AND metric_name=* – you must specify at least one metric_name filter to obtain data point values from. You can specify one or more metric_names, or use wildcards.
BY app, metric_name – you can optionally provide a group-by argument to break out the results by dimensions and/or metric_name.
You’ll note that the term ‘metric_name’ seems to be a ‘pseudo-type’ in that you can use this term to perform grouping functions much the same as you would an individual field name such as host or source, etc., while still picking up multiple named metric fields such as metric_name:cpu.util.pct, metric_name:cpu.util.p95, etc. with the same ‘BY’ clause.
In summary, you can leverage the mstats command to perform a statistical function against a set of _values, WHERE index=<index>, AND any additional filters, AND a metric_name(s), grouped BY applicable dimensions and/or metric_names.
The supported aggregation and time functions for the mstats command include:
Conclusion
Now that you’ve seen how to inspect and become familiar with metrics indexes and how to extract data from them using the mcatalog, mpreview, and mstats commands, you’re ready to put that data to work. Part 5-9 of this series will cover retrieving data from metrics indexes followed by examples of how to analyze data from metrics indexes and use it in visualizations, as well as some notes on naming conventions and troubleshooting. See you there!


