
This topic is split into a nine-part series to improve readability – this is the fifth installment which covers how to retrieve the data in metrics indexes.
Parts 1-3 of this series cover what metrics indexes are and how to create and populate one:
- Comparing events and metrics indexes – they are a bit different.
- Creating metrics indexes – and how to store multiple measurements in each event.
- Storing event data into metrics indexes – great for saving measurements and trend history.
Parts 4-5 of the series outlines how to inspect and extract data from metrics indexes:
- Investigating metrics indexes – this is trickier than with events.
- Retrieving data from metrics indexes – this is too.
Parts 6-9 wrap up the series with examples of how to analyze data from metrics indexes and use it in visualizations, as well as some notes on naming conventions and troubleshooting:
- Analyzing metrics data – much the same as events data, but there are some twists.
- Visualizing metrics data – formatting the data correctly helps.
- Naming conventions for metrics and dimensions – structure is important
- Troubleshooting metrics indexes – what could go wrong?
tl;dr
“My simple definition and mental model of metrics indexes, based on a foundational understanding of events indexes, is that metrics indexes are designed to store numeric measurements in a highly efficient manner, and consist of events that contain just the four standard Splunk index fields: _time, source, sourcetype, and host, along with numeric measurements that are stored with a metric_name, and ‘dimension’s which are string fields that can be used for filtering and grouping the data sets.”
Retrieving Data From Metrics Indexes
The example SPL provided in the mstats discussion above can be used to extract and perform aggregation and statistical analysis of multiple data points in a metrics index.
If you need to work with data points in specific metrics events, you can leverage the mpreview command to create an events-like data set, upon which you can apply additional commands for filtering and formatting:
					| mpreview target_per_timeseries=0 index=app_statistics_metrics
| bin _time span=15m
| fields _time app host metric_name*
| fields - _raw
| rename metric_name:* AS *
| table _time host app *
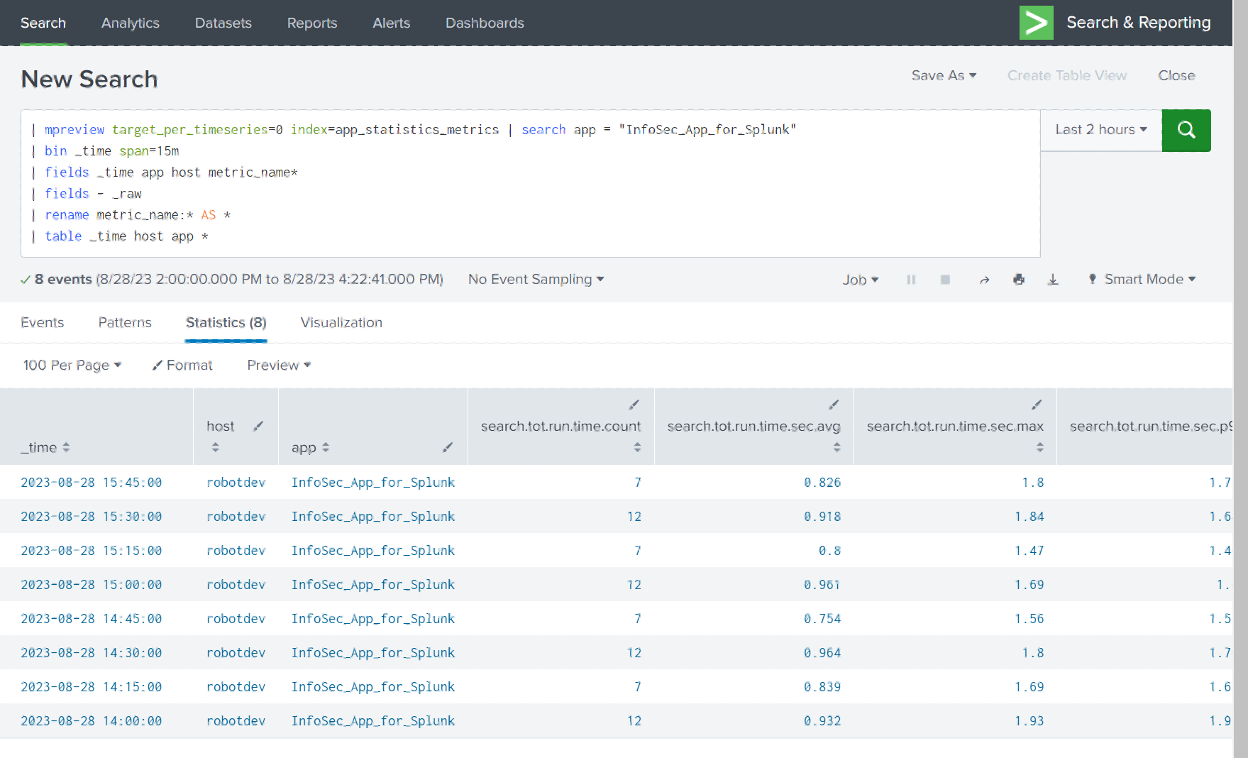
It should be noted that using mpreview will not be as performant as using mstats to retrieve and perform operations on metrics data, since mpreview will result in all events (after filtering) being sent to the user search head for further manipulation; mstats will perform statistical aggregation on the data set at the indexers (distributing the processing load) and return just those results to the search head. When dealing with high volume data sets, this can make a huge difference in workloads and search times. I’ll suggest that mpreview is best utilized for investigations and troubleshooting only – use mstats for serious work.
Conclusion
Now that you’ve seen how to inspect and become familiar with metrics indexes, how to extract data from them using the mcatalog, mpreview, and mstats commands and how to retieve data from metrics indexes, you’re ready to put that data to work. Part 6-9 of this series will cover examples of how to analyze data from metrics indexes and use it in visualizations, as well as some notes on naming conventions and troubleshooting. See you there!
If You Found This Helpful...
You don’t have to master Splunk by yourself in order to get the most value out of it. Small, day-to-day optimizations of your environment can make all the difference in how you understand and use the data in your Splunk environment to manage all the work on your plate.
Cue Atlas Assessment: Instantly see where your Splunk environment is excelling and opportunities for improvement. From download to results, the whole process takes less than 30 minutes using the button below:


