
In this article, I will be discussing the topic of analyzing metrics data using splunk. This topic is split into a nine-part series to improve readability – this is the sixth installment which covers how to retrieve the data in metrics indexes.
Parts 1-3 of this series cover what metrics indexes are and how to create and populate one:
- Comparing events and metrics indexes – they are a bit different.
- Creating metrics indexes – and how to store multiple measurements in each event.
- Storing event data into metrics indexes – great for saving measurements and trend history.
Parts 4-5 of the series outlines how to inspect and extract data from metrics indexes:
- Investigating metrics indexes – this is trickier than with events.
- Retrieving data from metrics indexes – this is too.
Parts 6-9 wrap up the series with examples of how to analyze data from metrics indexes and use it in visualizations, as well as some notes on naming conventions and troubleshooting:
- Analyzing metrics data – much the same as events data, but there are some twists.
- Visualizing metrics data – formatting the data correctly helps.
- Naming conventions for metrics and dimensions – structure is important
- Troubleshooting metrics indexes – what could go wrong?
tl;dr
“My simple definition and mental model of metrics indexes, based on a foundational understanding of events indexes, is that metrics indexes are designed to store numeric measurements in a highly efficient manner, and consist of events that contain just the four standard Splunk index fields: _time, source, sourcetype, and host, along with numeric measurements that are stored with a metric_name, and ‘dimension’s which are string fields that can be used for filtering and grouping the data sets.”
Analyzing Metrics Data
Once you have created the mpreview or mstats SPL to extract and group the metrics data points of interest, the standard Splunk commands and utilities can be applied to further filter, manipulate, and analyze the data. mstats will provide tabular data; you can then apply the rename function to the various metric_name fields along with the table and sort commands to control content and order.
One point to mention here is that while a metric_name:<metric> field is indeed a field, the long field names that result from the metric_name: prefix plus what may be a longer suffix due to the use of the hierarchical dot-notation scheme recommended by metrics naming convention can be somewhat cumbersome to work with and difficult for users to read. You may want to use the rename or stats command to derive shorter, easier to work with field names, as in the examples below:
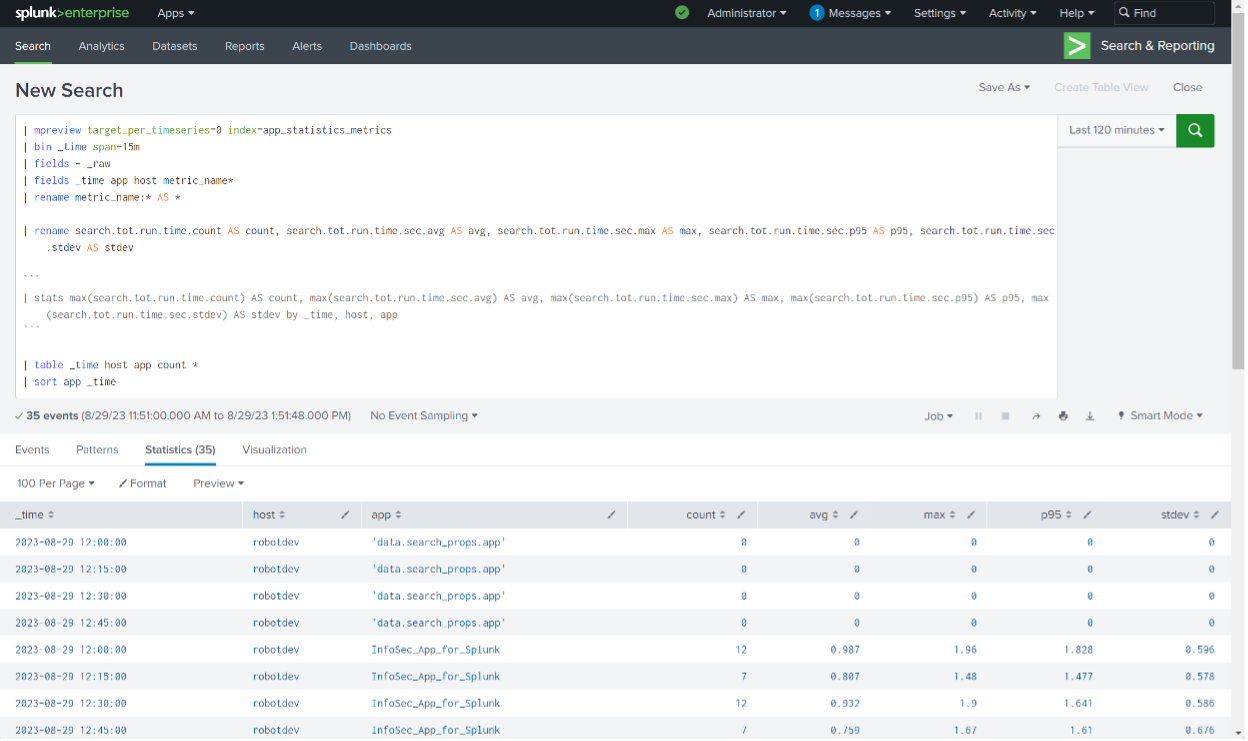
Get the data:
					| mpreview target_per_timeseries=0 index=app_statistics_metrics
| bin _time span=15m
| fields _time app host metric_name*
| fields - _raw
| rename metric_name:* AS *
# This is useful for reducing field name lengths
```Rename the fields```
| rename search.tot.run.time.count AS count, search.tot.run.time.sec.avg AS avg, search.tot.run.time.sec.max AS max, search.tot.run.time.sec.p95 AS p95, search.tot.run.time.sec.stdev AS stdev
OR
					```Aggregate and rename the fields using stats
```
| stats max(metric_name:search.tot.run.time.count) AS count, max(metric_name:search.tot.run.time.sec.avg) AS avg, max(metric_name:search.tot.run.time.sec.max) AS max, max(metric_name:search.tot.run.time.sec.p95) AS p95, max(metric_name:search.tot.run.time.sec.stdev) AS stdev by _time, host, app
```use table and sort to arrange the data as desired
```
| table _time host app count *
| sort app _time
Either approach above will result in a tabular data set with shorter field names:
Additional points to consider:
- It is good practice to select just the fields you need for your analysis early in the SPL using the ‘fields’ command, which reduces the amount of data returned from the indexers to the search head to just the fields specified – this will increase search performance and reduce Splunk resource loading.
- If you’re using mpreview to retrieve events, you can eliminate the _raw field from the data by using a | fields – _raw Note the space between the minus sign and the _raw field specifier.
- Using the rename command will rename the specified fields and leave any additional fields in place and unchanged.
- You may want to use a | rename metric_name:* AS * line early in your SPL to reduce the amount of typing needed elsewhere.
- If you used the rename command and prefer to see the data in tabular format (as opposed to a list of events), you can use the table command, which also gives you the ability to control the order of the fields displayed, and a sort to control the order of the data.
- If you’re using the mstats or stats command, you must apply a function (avg, max, min, etc.) against the data in a specified field in most cases. Remember that if you’re using a ‘bin’ command with a span that matches the original data sample interval (data points every 15 minutes, in these examples), then it doesn’t matter too much what function you apply with the stats command – you’ll get the single value for each sample period, because there’s only one to work with. However, if you want to aggregate across multiple samples by using a longer span with the bin command, you will need to select the appropriate statistical function for the desired outcome – min, max, avg, percentile, and so on.
- The mstats command is more performant than using mpreview – so use it wherever possible.
Conclusion
Now that you’ve seen how to inspect and become familiar with metrics indexes, how to extract data from them using the mcatalog, mpreview, and mstats commands, how to retieve and analyze data from metrics indexes, you’re ready to put that data to work. Part 7-9 of this series will cover examples of how to use it in visualizations, as well as some notes on naming conventions and troubleshooting. See you there!
If You Found This Helpful...
You don’t have to master Splunk by yourself in order to get the most value out of it. Small, day-to-day optimizations of your environment can make all the difference in how you understand and use the data in your Splunk environment to manage all the work on your plate.
Cue Atlas Assessment: Instantly see where your Splunk environment is excelling and opportunities for improvement. From download to results, the whole process takes less than 30 minutes using the button below:


