
This topic is split into a nine-part series to improve readability – this is the first installment in the series.
Parts 1-3 of this series cover what metrics indexes are and how to create and populate one:
- Comparing events and metrics indexes – they are a bit different.
- Creating metrics indexes – and how to store multiple measurements in each event.
- Storing event data into metrics indexes – great for saving measurements and trend history.
Parts 4-5 of the series will outline how to inspect and extract data from metrics indexes:
- Investigating metrics indexes – this is trickier than with events.
- Retrieving data from metrics indexes – this is too.
Parts 6-9 wrap up the series with examples of how to analyze data from metrics indexes and use it in visualizations, as well as some notes on naming conventions and troubleshooting:
- Analyzing metrics data – much the same as events data, but there are some twists.
- Visualizing metrics data – formatting the data correctly helps.
- Naming conventions for metrics and dimensions – structure is important
- Troubleshooting metrics indexes – what could go wrong?
tl;dr
“My simple definition and mental model of metrics indexes, based on a foundational understanding of events indexes, is that metrics indexes are designed to store numeric measurements in a highly efficient manner, and consist of events that contain just the four standard Splunk index fields: _time, source, sourcetype, and host, along with numeric measurements that are stored with a metric_name, and ‘dimension’s which are string fields that can be used for filtering and grouping the data sets.”
As a long time Splunker, I have become increasingly aware of the existence and growth of ‘metrics’ data use in the IT industry, and my need to better understand how to work with Splunk’s metrics indexes. I recently had an opportunity to build an analytics solution in Splunk that leverages a metrics index – so I took some notes along the way, which I’ll share in this article. Metrics indexes are a bit of a different creature; if you’re just getting started on your metrics journey, I hope this will help shorten your path.
For the most part, metrics are a component of observability solutions. Metrics are values derived from counts or measurements that are calculated or aggregated over a period of time. Metrics can originate from a variety of sources, including infrastructure, hosts, services, cloud platforms, and IoT devices.
Splunk metrics indexes were introduced in the October 2017 Splunk Enterprise version 7.0 release as an alternative to using the ‘events’ index type to store time series numeric data.
Using metrics indexes in Splunk offers a significant boost in performance when storing and retrieving numerical data. Splunk metrics indexes use a highly structured format to handle the higher volume and lower latency demands associated with most metrics data, and storing data in metrics indexes provides faster search performance and less index storage requirements as compared to saving the same data in events indexes.
You will see the term MTS (metric time series) used in discussions of metrics. An MTS is a collection of data points that have the same metric – such as CPU utilization – and the same set of dimensions, such as location and hostname. A series of measurements of CPU utilization for a given host over time is a Metric Time Series.
My simple definition and mental model of metrics indexes, based on a foundational understanding of events indexes, is that metrics indexes are designed to store numeric measurements in a highly efficient manner, and consist of events that contain just the four standard Splunk index fields: _time, source, sourcetype, and host, along with numeric measurements that are stored with a metric_name, and ‘dimension’s which are string fields that can be used for filtering and grouping the data sets.
Metrics indexes are by nature somewhat different than events indexes, and the methods and tools for working with them are different as well. This article will outline these differences and provide examples of getting data into and out of metrics indexes, as well as strive to help you build some experience and a mental model of metrics indexes that aids in understanding and working with them intuitively.
Comparing events and metrics indexes
Assuming you are familiar with Splunk events indexes, you know that every event regardless of data source includes a timestamp (_time) and a sourcetype, source, and host field; the same is true of metrics indexes. But this is where the similarity fades.
Event indexes store timestamped events that can have multiple fields containing string or numeric data (name=”Joe”, cpu_pct=24.5, etc.), JSON, XML, or even other key-value formats using less common delimitations such as spaces or other delimited data types. When you run a search against events indexes, you can (should) apply filters for the index, sourcetype and one or more other fields to reduce the result set to just the data of interest and ensure the time range is only as large as needed to avoid searching through more data than is needed to improve search performance.
Metrics indexes store ‘metric data points’, which are a single measurement with a metric_name, a timestamp, and one or more ‘dimensions’ that might be considered labels for each measurement type. The _indextime field is absent from metrics indexes, and the source is optional.
Note that a log is an event that occurred, and a metric is a measurement of some element of a system. Splunk introduced metric indexes in addition to traditional indexes to allow for more efficient storage and search for both events and metrics data. Splunk metric indexes use less storage space than events indexes, and increase query search speed 500 times, using less system resources at lower licensing cost. I will use the term ‘events’ to refer to the recording of metric data points in this article, despite the risk of that not being the most accurate term.
The fields that make up a metrics index are depicted in the table below:
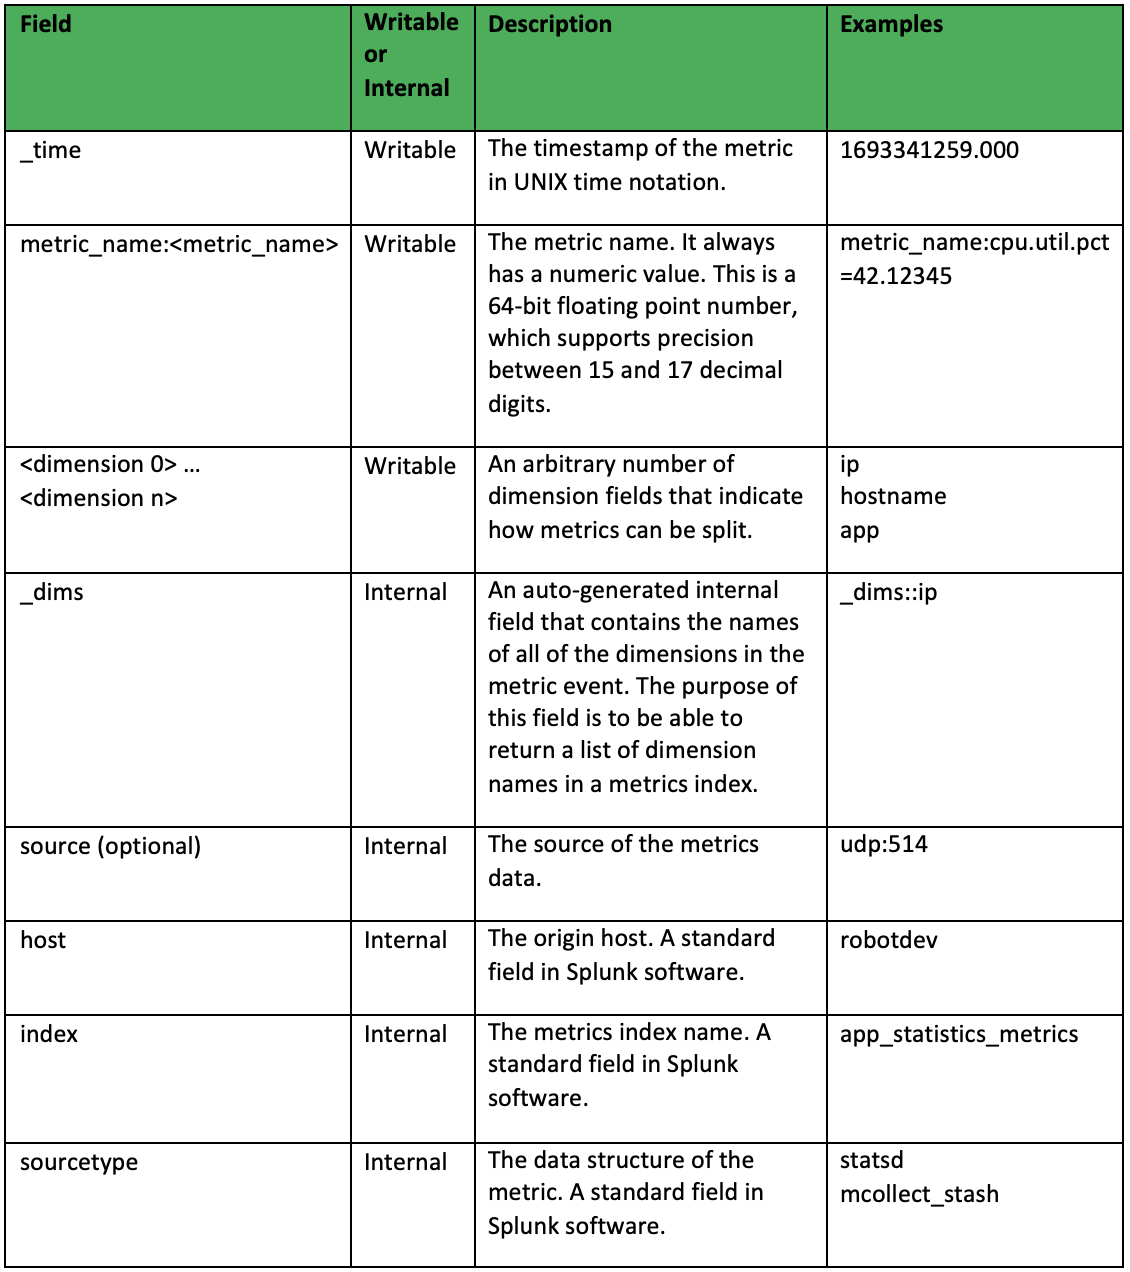
Some additional notes about metrics indexes include:
- Metrics timestamps have per-second precision by default. You can enable millisecond precision when creating the index.
- Numeric value measurements are 64-bit floating point numbers (only), which provide a precision of between 15 and 17 decimal digits.
- Dimensions are stored as string values – even if they consist of a number.
- Metrics names are case sensitive, and cannot start with a number or underscore.
Working with metrics indexes may not be immediately intuitive – it wasn’t for me. It may be helpful to work through the examples below and then re-read this section to help solidify your mental model of metrics indexes. If you don’t want to create the suggested index and saved search, you can poke through the _metrics index that Splunk saves internal metrics to – but be warned that there is a lot to consume there for an initial learning path.
Conclusion
In this segment we covered what metrics indexes are. Part 2-3 of this series will outline how to create metrics indexes, and how to use the mcollect command to save data extracted from event logs into a metrics index.
If you found this helpful…
You don’t have to master Splunk by yourself in order to get the most value out of it. Small, day-to-day optimizations of your environment can make all the difference in how you understand and use the data in your Splunk environment to manage all the work on your plate.
Cue Atlas Assessment: Instantly see where your Splunk environment is excelling and opportunities for improvement. From download to results, the whole process takes less than 30 minutes using the button below:


