
This topic is split into a nine-part series to improve readability – this second installment covers how to create a metrics index.
Parts 1-3 of this series cover what metrics indexes are and how to create and populate one:
- Comparing events and metrics indexes – they are a bit different.
- Creating metrics indexes – and how to store multiple measurements in each event.
- Storing event data into metrics indexes – great for saving measurements and trend history.
Parts 4-5 of the series will outline how to inspect and extract data from metrics indexes:
- Investigating metrics indexes – this is trickier than with events.
- Retrieving data from metrics indexes – this is too.
Parts 6-9 wrap up the series with examples of how to analyze data from metrics indexes and use it in visualizations, as well as some notes on naming conventions and troubleshooting:
- Analyzing metrics data – much the same as events data, but there are some twists.
- Visualizing metrics data – formatting the data correctly helps.
- Naming conventions for metrics and dimensions – structure is important
- Troubleshooting metrics indexes – what could go wrong?
tl;dr
“My simple definition and mental model of metrics indexes, based on a foundational understanding of events indexes, is that metrics indexes are designed to store numeric measurements in a highly efficient manner, and consist of events that contain just the four standard Splunk index fields: _time, source, sourcetype, and host, along with numeric measurements that are stored with a metric_name, and ‘dimension’s which are string fields that can be used for filtering and grouping the data sets.”
Creating metrics indexes
Metrics indexes are created in the same manner as events indexes. You can create them with Splunk Web (Settings > Indexes > New Index and click the Metrics button), the CLI, a REST call, or by manually adding a stanza and applicable entries in an indexes.conf file.
The contents of the indexes.conf file will use the same format and entries as with event indexes, with the exception that a metrics stanza must include a ‘datatype=metric’ entry and an optional ‘metric.timestampResolution = ms’ entry if millisecond resolution is selected (the default is 1 second – so no entry is required for 1 sec resolution).
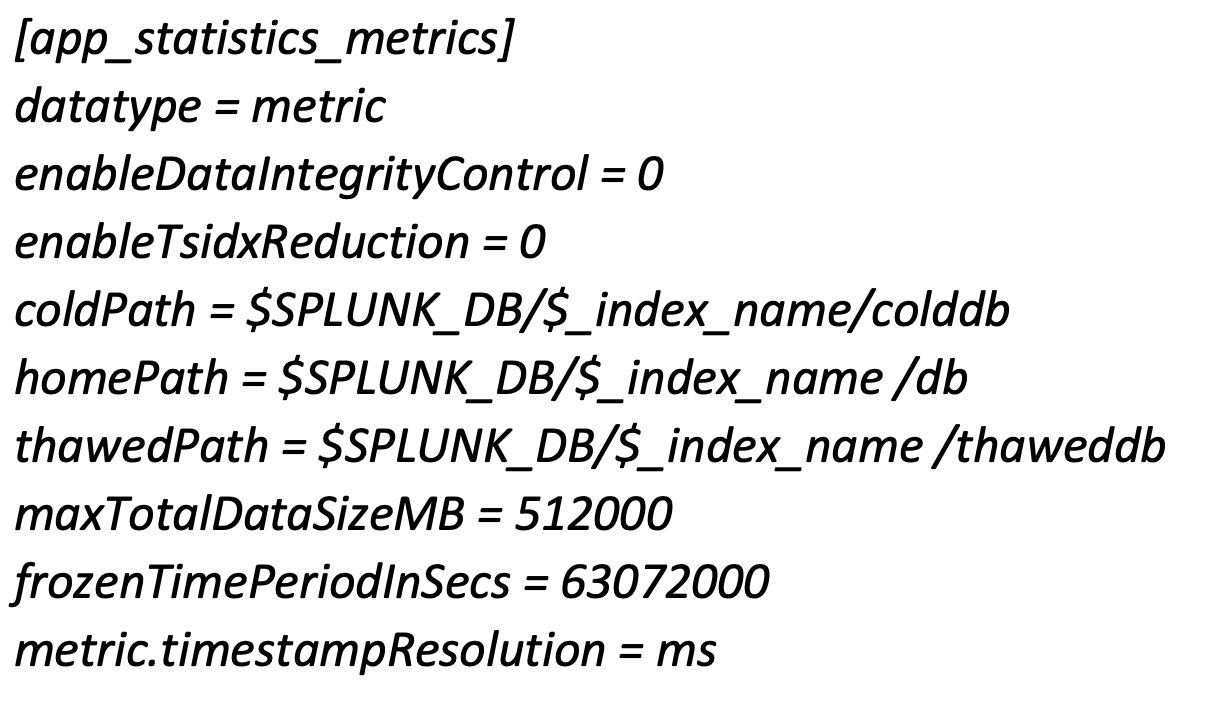
Note that millisecond timestamp resolution can result in decreased search performance.
It may be prudent to edit the indexes.conf file to include a ‘frozenTimePeriodInSecs = 63072000’ (2 years) or similar entry to limit the retention time to something less than the default of 6 years unless you just want to limit the index size with the maxTotalDataSizeMB entry (or both).
Be aware that metric indexes don’t support the delete command, so take care when creating your metric_names, dimensions, etc. Try to achieve a well thought out, hierarchical structure for labeling measurements, or be prepared to exclude older, poorly identified measurements from your final analysis product or just delete the index and start over.
Conclusion
In this segment, we covered how to create a metrics index. In parts 3-5 of this series, we will outline how to use the mcollect command to save data extracted from event logs into a metrics index, how to inspect and become familiar with metrics indexes, and how to extract data from them – see you there!
Subscribe to the Kinney Group blog to make sure you don’t miss out on part 3!
If you found this helpful…
You don’t have to master Splunk by yourself in order to get the most value out of it. Small, day-to-day optimizations of your environment can make all the difference in how you understand and use the data in your Splunk environment to manage all the work on your plate.
Cue Atlas Assessment: Instantly see where your Splunk environment is excelling and opportunities for improvement. From download to results, the whole process takes less than 30 minutes using the button below:


