Skip to content
Article

A Beginner’s Guide to Splunk Logs

KGI Avatar
 

Written by: Michael Simko | Last Updated:

 
February 23, 2024
 
A beginners guide to splunk log


Originally Published:

 
January 27, 2023

Splunk keeps various logs about the happenings of Splunk processes and the various components used. We’ll list the primary logs for Splunk Enterprise and where to find them. We’ll also soapbox with advice on when to use the logs directly and when to use search.

Why use Splunk Logs?

Splunk is a fantastic log analysis tool, and at the heart of the product is the notion that you don’t read logs — instead, you search in Splunk. Companies pay for Splunk to consolidate logs so admins may avoid logging onto each server to look at logs. Why, then, would a Splunk admin not use Splunk SPL to debug their Splunk instance instead of SSH or RDP to a server and manually find the logs?  

If your Splunk instance cannot send its logs to Splunk, say you have a new forwarder not yet checking in, then connect to the server and check logs. Otherwise, it would be best if you used the power of Splunk to search those internal logs.  

Use the fields source and component to further narrow your searches to the pieces of the log that you want to view. 

Fun Tip: You can search from the command prompt if you have a shell open on a Search Head or Indexer. Try:

$SPLUNK_HOME/bin/splunk search “index=_internal host=xxx”   

Okay, guilting time is over.

Splunk Log Location

Splunk’s internal logs are in $SPLUNK_HOME/var/log/splunk. 

The variable $SPLUNK_HOME refers to wherever Splunk has been installed.

Splunk Logs

Binary OS SPLUNK_HOME Default Location 
Splunk Enterprise Linux /opt/splunk 
Windows C:\Program Files\Splunk 
 Mac 

/Applications/Splunk (if .dmg) 

/opt/splunk (if using tar and nix convention) 

Universal Forwarder Linux /opt/splunkforwarder 
 Windows C:\Program Files\SplunkUniversalForwarder 
 Mac /Applications/SplunkForwarder 
 Solaris /opt/splunkforwarder 
 FreeBSD /opt/splunkforwarder 
 AIX /opt/splunkforwarder 

Splunk Enterprise Logs: 

The primary Splunk Enterprise Logs that admins use are: 

splunkd.log 

The main log for Splunk Enterprise is splunkd.log. Suppose your server isn’t starting (say you made a typo in indexes.conf that prevents Splunk from loading). You’d need to check this log. The splunkd.log indexes to the _internal index. 

audit.log 

What the users have done is stored in audit.log. This log is often mandated to be kept for extended periods to match compliance requirements. Audit.log indexes to the _audit index. 

configuration_change.log 

Configuration Change is a new log that contains the changes to Splunk Enterprise .conf files. These logs are added to the new (to Splunk Enterprise 9.x) _configtracker index. 

License_usage.log 

The license usage log contains the indexed volume in bytes of the data indexed. This log only exists on a license manager. 

License_usage_summary.log 

This log contains daily indexed volumes per pool, stack, and host on a license manager. The license_usage_summary.log indexes into _telemetry.

Mongod.log 

The log for the KV Store helps find connection issues and SSL errors. 

Other Logs 

There are several more logs of less use for admins. For a complete list of Splunk Enterprise Logs, see: https://docs.splunk.com/Documentation/Splunk/latest/Troubleshooting/WhatSplunklogsaboutitself 

List Which Logs are In Which Internal Index: 

You can list which logs are in which internal index with this search. I excluded _introspection because it is verbose and most of those are json and not useful on their own. 

| metasearch index=_* index!=_introspection 
|  stats count by index, source 

Log Rotation Settings: 

The historical rotation for most logs is set in $SPLUNK_HOME/etc/log.cfg.

Note: Do not make changes to this file. Upgrades overwrite the default files. See below for Short-term and Long-term options for modifying log settings. 

Short-term Changes in logging level: 

In the Splunk Web interface: Settings > Server Settings > Server Logging  

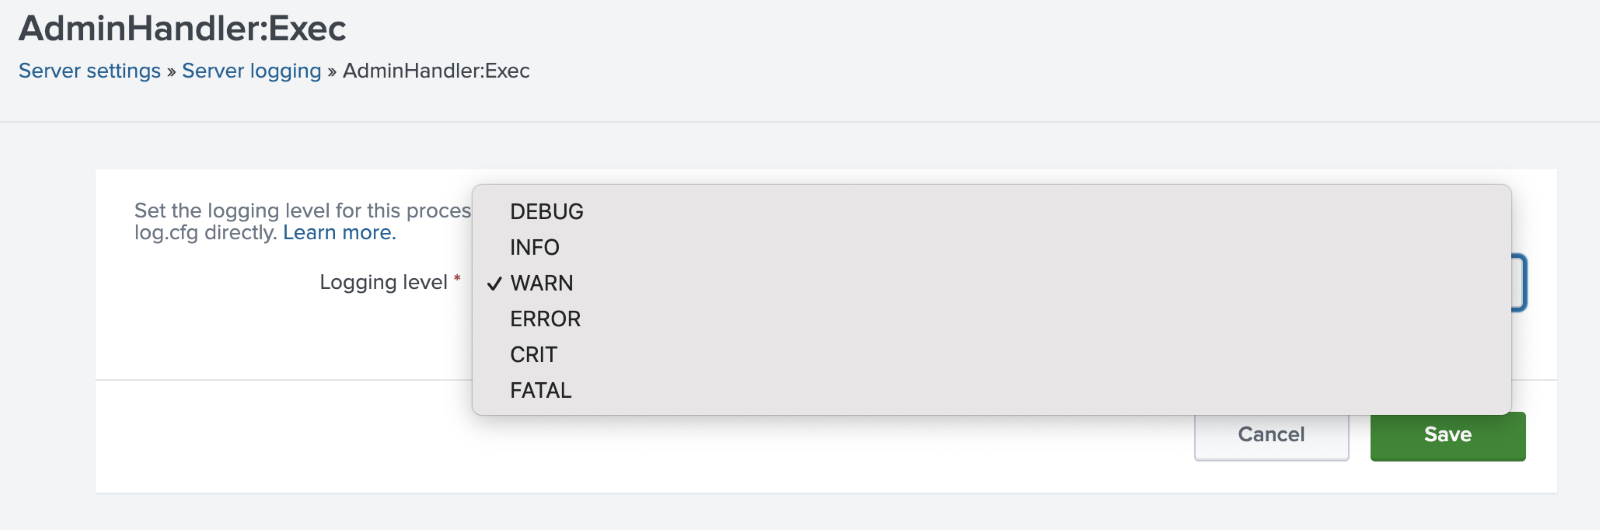
Then select the element from the (extensive) list and adjust the Logging Level desired. See the Logging Levels section below for further information on these settings.

Log Settings in Splunk 9

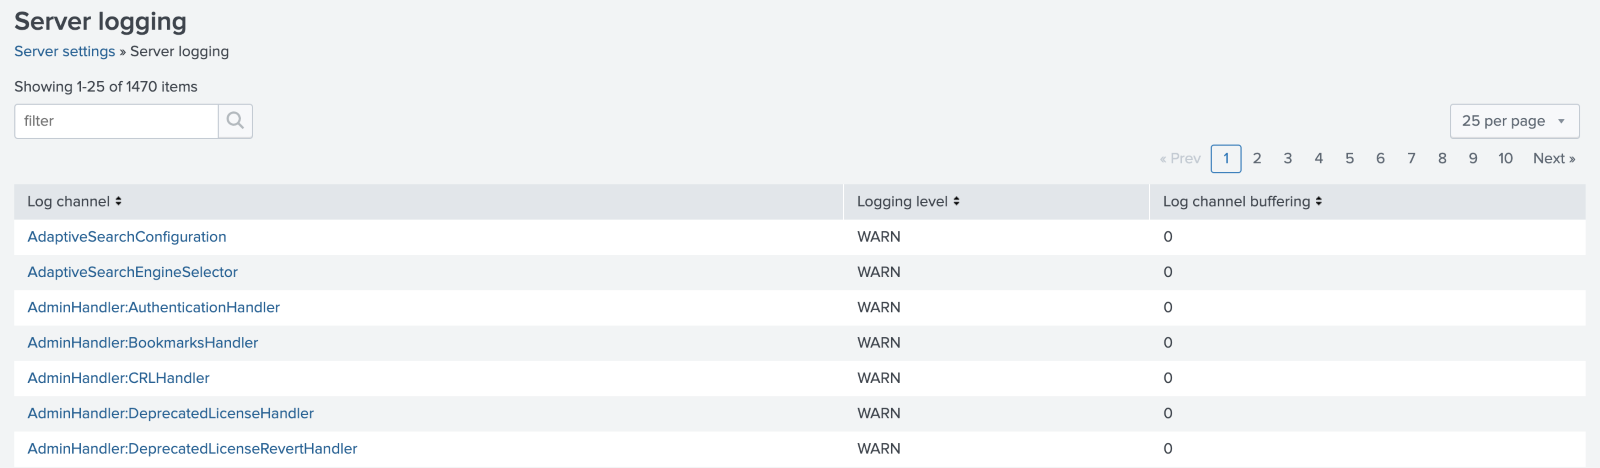
Long-term Changes in Log Settings: 

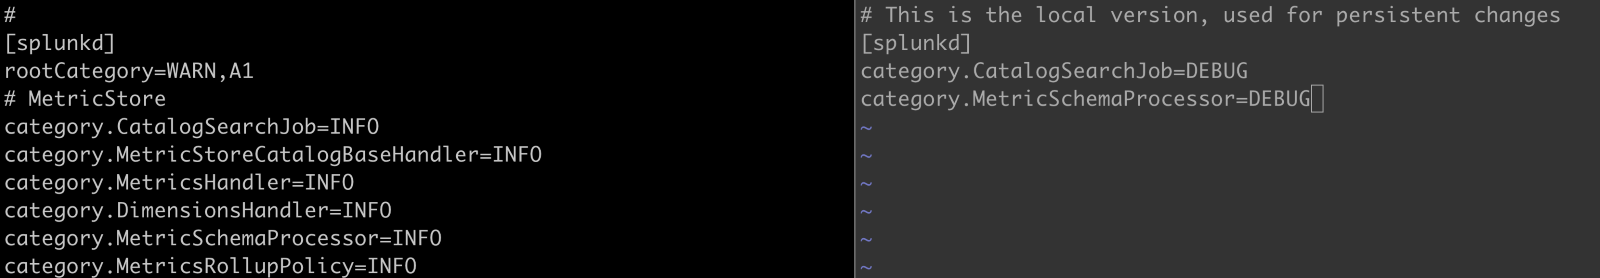
For long-term (e.g., persistent – persist past a restart) changes to log levels or to modify the size of rotation, create a log-local.cfg in $SPLUNK_HOME/etc/log-local.cfg  

The proper way to handle defaults and locals is to copy the stanza (the name in the square brackets) and the key/value pair to change to the local file.  

Note: Log settings are different from other default/local combinations. The default is log.cfg, and the local is log-local.cfg, and those two files reside in the same directory/folder. 

Changing the Default (log.cfg) to the local (log-local.cfg)

Changing the Default (log.cfg) to the local (log-local.cfg)

Logging Levels:

Splunk processes start with different logging levels. Events log if they are at or exceed the logging level. For example, processes set to WARN or above also log ERROR or FATAL events. 

The Server Log Settings Are: 

  • DEBUG 
  • INFO 
  • WARN 
  • ERROR 
  • CRIT 
  • FATAL 

Changing the log levels temporarily via the Web UI.

Changing the log levels temporarily via the Web UI.

Debug Logs and the Curse of Too Much Information

The good news, setting Splunk to DEBUG logs a plethora of information. On the bad side, it can fill disk spaces and logs so much that it may obfuscate the real issue creating so many results.  

Do not leave DEBUG set long-term. Think of DEBUG as fixing an immediate issue. Sometimes you need to have DEBUG persist through reboots, but seriously, don’t forget and leave it set. 

Setting all processes to DEBUG 

The most logging method is to start Splunk in debug mode, which sets each process to DEBUG. Turning on Splunk in debug mode creates a tremendous number of log events, and it maybe too much in production.   

Setting the whole system to debug is recommended for test environments.  

If you have to do this for production, say you have a Heavy Forwarder and can’t find the process stopping your app from working, then do it only for a limited time.  

Consider yourself warned to do this sparingly. 

 Process for setting the entire Splunk to Debug 

  1. Open a Terminal on the server 
  2. Stop Splunk 
  3. Start Splunk with double-hyphen debug 
    • ./splunk start –debug 

Note: Recommendations list to move splunk.log to an archive (add a .old or something else) as the log will fill quickly and make standard logging hard to find. 

Conclusion

We discussed where Splunk logs reside on the file system, explored the critical Splunk logs and showed how to change log settings. We saw where Splunk indexes the logs and discussed how it is best to use Splunk to analyze logs since that is the purpose of Splunk.

If you found this helpful…

You don’t have to master Splunk by yourself in order to get the most value out of it. Small, day-to-day optimizations of your environment can make all the difference in how you understand and use the data in your Splunk environment to manage all the work on your plate.

Cue Atlas Assessment: Instantly see where your Splunk environment is excelling and opportunities for improvement. From download to results, the whole process takes less than 30 minutes using the button below:

Helpful? Don't forget to share this post!
LinkedIn
Reddit
Email
Facebook