

Searches are at the heart of Splunk. They power the insights that turn data into business value—and Atlas has plenty of them collected in the Search Library. Simple dashboards and ad-hoc searches, though, are only the first step: the real magic happens with the Splunk scheduler. However, as Splunkers will know, it’s all too easy to bog down an environment with poorly-planned search schedules, redundancies, and heavy jobs. Soon, this leads to skipped jobs, inaccurate results, and a slow and frustrating user experience.
Atlas has a first-of-its-kind solution.
The Scheduling Assistant application provides a real-time health check on the use of Splunk’s scheduler and scheduled searches. In addition, it includes a built-in mechanism to fix any issues it finds. Atlas’s powerful Scheduling Assistant ensures that your scheduled searches in Splunk are running efficiently by providing the visibility you need to make the most of your data resources.
Scheduler Activity
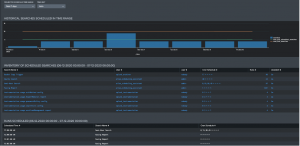
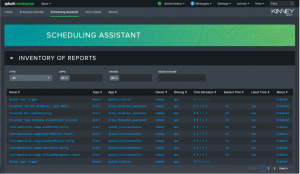
In Atlas’s Scheduling Assistant, you’ll find the Scheduler Activity resource. The Scheduler Activity tab is your starting point for assessing how efficiently your environment is currently executing scheduled Splunk searches. Then, the Scheduler Health Snapshot section offers a health score based largely on historic findings like skipped ratio and search latency, as well as a glimpse forward at future schedule concurrency.

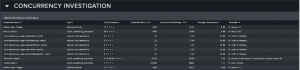
Below the Health Snapshot, the Concurrency Investigation section lets users view and sort their scheduled searches with a helpful translation of the scheduled run times. These dashboards display Atlas’s computed concurrency limits for a Splunk environment, which dictate the maximum number of searches that can be run at any given time.
These real-time insights inform how users can schedule searches for the fastest, most efficient results.
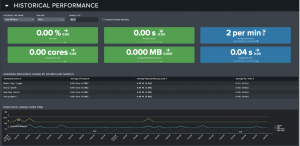
Next up is Historical Performance, which interprets how scheduled searches are running. This dashboard and graph display average CPU and physical memory used. Also included are search metrics like run time and latency, for example.
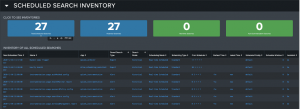
After Historical Performance, the Scheduled Search Inventory section provides details on all manually scheduled searches. It also allows users to quickly drill down to the Scheduling Assistant tool for any given search.
Scheduling Assistant
The Scheduling Assistant dashboard allows users to select a single scheduled search to investigate and modify.
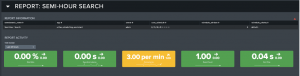
This section provides key metrics for the search’s activity to highlight any issues. Atlas users can experiment by changing the selected search’s scheduling setting. By editing the Cron setting and submitting a preview, users can compare the Concurrent Scheduling and Limit Breech Ratio to see if their tested Cron setting improves overall outcomes.
If the modified schedule is satisfactory, the user can then save changes and update the saved search—all within the Atlas platform.
Cron Helper
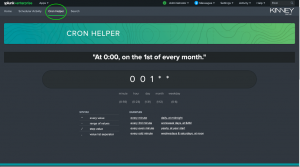
Splunk uses Cron expressions to define schedules, and Atlas’s Cron Helper tab provides a quick and easy way to test them. Not only does this tool enable fast, direct translations, it also acts as a learning tool for those new to Cron.
The syntax key below the Cron bar displays the definitions of each character, allowing users to try their hand at creating and interpreting their own Cron expressions.
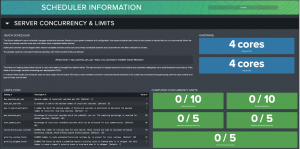
Scheduler Information
The Scheduler Information dashboard is a knowledge base for the complex definitions and functions that power Splunk’s scheduled searches. The environment’s limits.conf is present for review, and the current statistics on currency limits are provided for clarity.
These relatively static values are vital to understanding the scheduler and taking full advantage of its potential.
In Conclusion
Powered by these four revolutionary features, Atlas’s Scheduling Assistant provides unprecedented insight into Splunk searches. The power to survey, schedule, and change searches is in the user’s hands, saving your team time and resources.
There’s more to come from Atlas!


