
Splunk is a fantastic tool for monitoring and analyzing networking environments. When performing investigations on your network, you should ask yourself how long it will take to find the resolution to the problem. Or how many utilities (like netstats, ifconfig, dig, and others) will you need to know how to use for your investigation? With Splunk the answers are simple. In most cases, Splunk can reduce your investigation time, and all you need to know is how to use the Splunk search language.
In this blog, we will explore how Splunk can help you maintain your Cisco networking systems with time-saving tips for determining the root cause of network issues. But how do you check to see if Splunk is getting your Cisco networking gear logs?
Cisco Logs in Splunk
The short answer is, you look for events from your Cisco devices in the Splunk index(s) and sourcetype(s) that were configured to hold those logs in your environment. In the following sections, we’ll talk about how to run some Splunk searches looking for some specific issues and data points that should serve as an example.
A prerequisite to using Splunk is having your network switches, routers, and firewalls configured to be monitored by Splunk. We will explore how to monitor and analyze Cisco Networking log sources, but keep in mind Cisco is just one of many networking system types that can be monitored and analyzed by Splunk. The queries we will review can be applied to other technologies with minor changes.
To understand how to examine Cisco logs with Splunk, let’s assume that you are ingesting Cisco IOS (Internetworking Operating System) or network switch events, Cisco ASA (Adaptive Security Appliance) or network firewall events and Cisco ISE (Identity Services Engine), or network authentication events.
Cisco Switches and Routers
Cisco switches and routers allow systems to connect and communicate with each other across a network. Cisco IOS switch and router logs can be monitored by Splunk. Splunk provides an add-on (Cisco Networks Add-on for Splunk) for incorporating knowledge objects for data enrichment, field normalizing, and mapping data models.
When monitoring Cisco switch events, one of the important things to detect is port flapping. Port flapping occurs when an interface on a physical switch repeatedly connects and disconnects for about 10 seconds or more. In Splunk, a search of the Cisco switch logs might look like this:
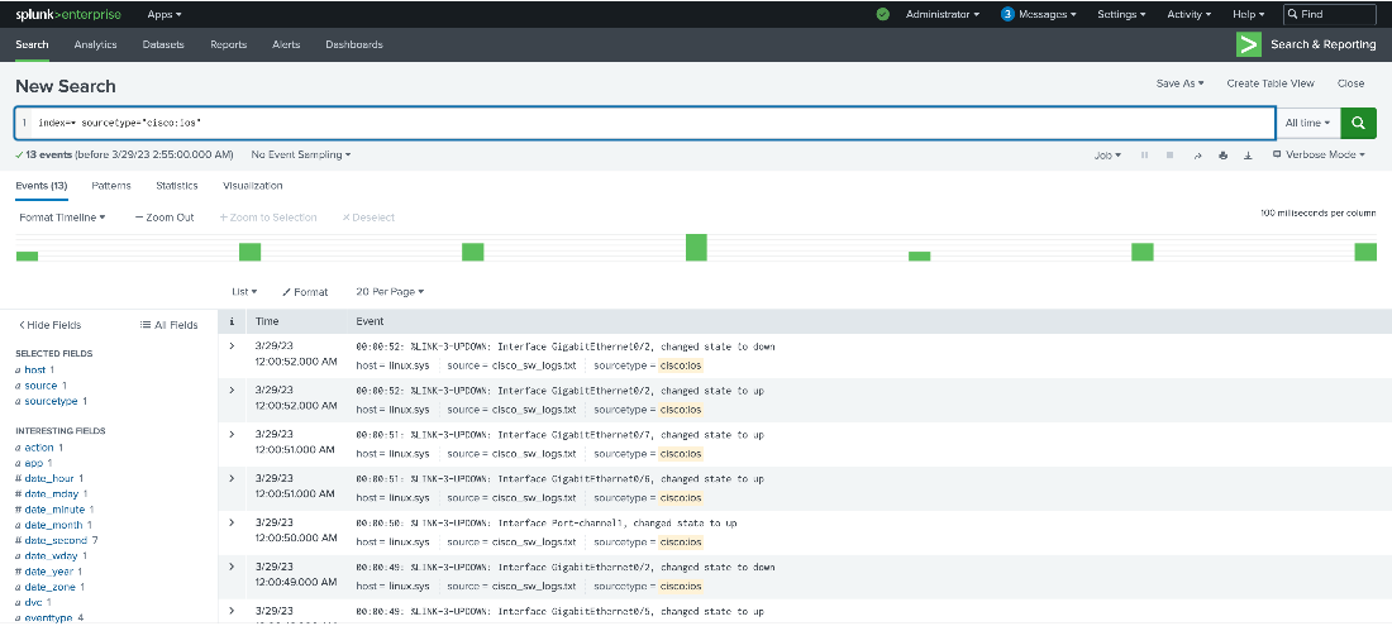
Under closer scrutiny you see that interface “GigabitEthernet0/2” has flapped from down to up and to down within 3 seconds. A more actual way of determining if there is flapping is to use the transaction command as shown below:
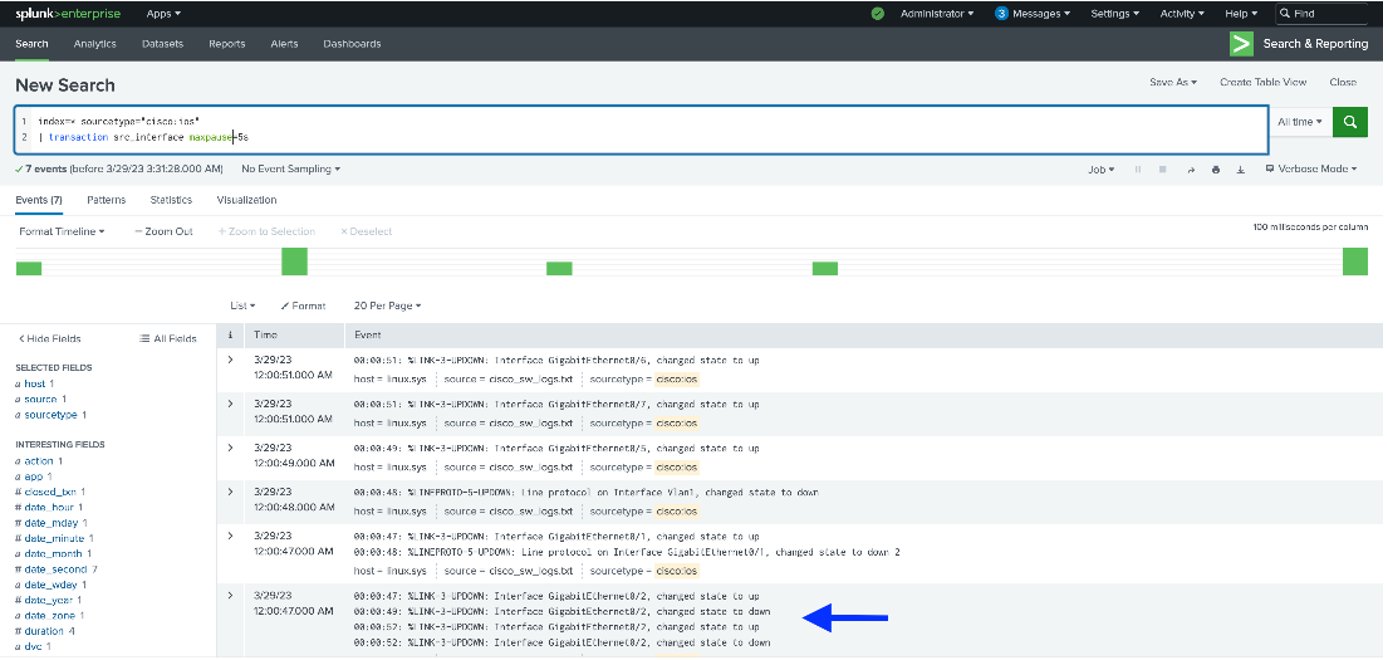
Let us examine the query in detail:
These parameters search for all Cisco switch events over a preset time frame.
index=* sourcetype=”cisco:ios”
The transaction commands examine for transactions on the “src_interface” field over 5 seconds.
| transaction src_interface maxspan=5s
As illustrated, in the event where the arrow is pointed, the “GigabitEthernet0/2” switch is experiencing port flapping.
Cisco Firewall Data Source
The firewall is a device that manages access to internal systems from external network sources. Cisco ASA firewall is used by many government and commercial organizations to protect their internal networks. Cisco ASA firewall provides event logging for tracking activity on the device and Splunk can monitor these logs. Splunk enhances the monitoring of these logs through an add on (Splunk Add-on for Cisco ASA) that provides knowledge objects for data enrichment, field normalizing, and mapping data models.
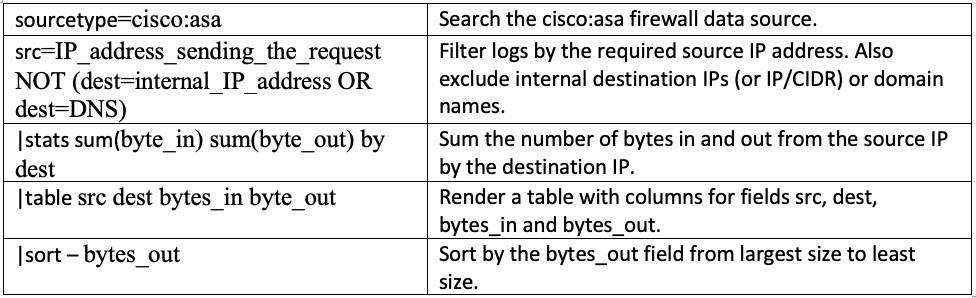
When monitoring Cisco Firewall connections, a typical use case would be to monitor the amount of traffic between users and external websites and detect unusually large volumes. Then establish alerts when traffic becomes too high so this can be addressed by network management teams. A typical Splunk search for this might be the following:
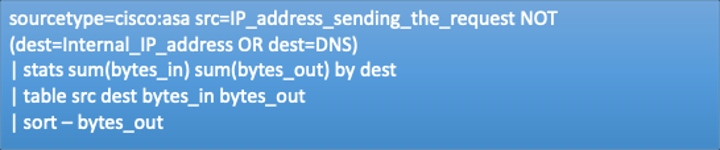
Here is the breakdown of this search:
The output from the search might look like this:
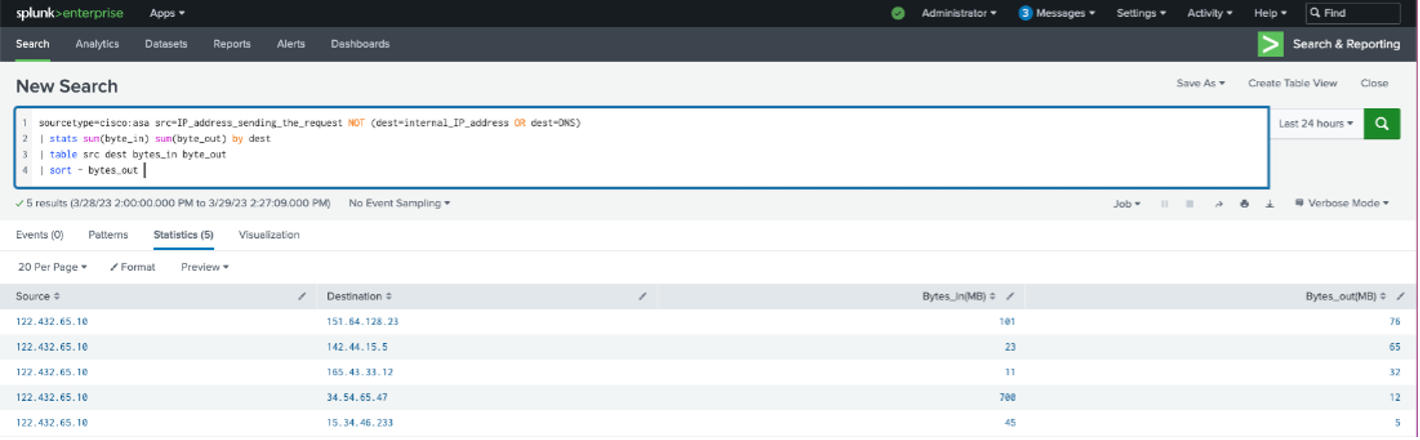
These results can be used to determine outliers, set up alerts, and reach offenders for remediation action.
Cisco Identity Management Data Source
Cisco Identity Service Engine (ISE) is used by organizations to provide identity management, network control, and policy enforcement for your network devices. Cisco ISE provides event logging for tracking activities and Splunk can monitor these logs. Splunk enhances the monitoring of these logs through an add on (Splunk Add-on for Cisco Identity Service ISE) that provides knowledge objects for data enrichment, field normalizing, and mapping data models.
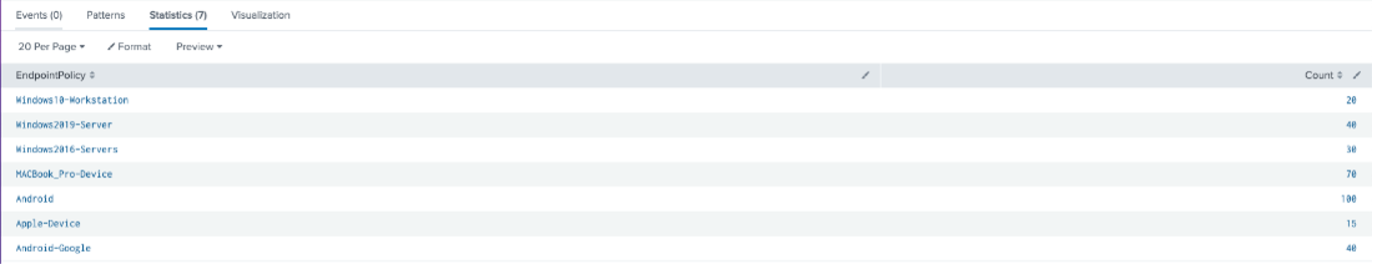
Use Splunk to monitor and analyze Cisco ISE events for auditing, fault management, and troubleshooting. One valuable use case is to monitor the registered systems under management by the Cisco ISE appliance. Using an add-on’s Event-type knowledge objects this can be accomplished with a simple search:

Which produces an output such as this:
You can use a pie chart visual as well for more clarity:

Let us examine this search:
An Event-type is a Splunk knowledge object that represents a category of events. Event-types match to the same search string. The search string traverses through the logs in a Cisco ISE index in Splunk. The “DeviceRegistrationStatus is filtered by a value of “Registered\\.” This represents the registered events that are returned from the Event-type.
eventtype=cisco-ise-profiler DeviceRegistrationStatus=”Registered\\”
This next line simply performs a count by the EndpointPolicy which is the field that contains the device names.
| stats count by EndpointPolicy rename EndpointPolicy AS “Endpoint Policy” count AS Count
Conclusion
We have discussed use cases for monitoring and analyzing events from various Cisco appliances. The searches provided how you can determine if Cisco events are being ingested into Splunk and how to analyze your events. Last, an explanation of the search was provided so that you can determine how to perform your own Cisco system monitoring and analysis.
If you found this helpful…
You don’t have to master Splunk by yourself in order to get the most value out of it. Small, day-to-day optimizations of your environment can make all the difference in how you understand and use the data in your Splunk environment to manage all the work on your plate.
Cue Atlas Assessment: Instantly see where your Splunk environment is excelling and opportunities for improvement. From download to results, the whole process takes less than 30 minutes using the button below:


