
Are you looking to unleash the true potential of your data through powerful visualization tools? If so, you’re in the right place. In this article, we will explore the dynamic duo of Splunk and Tableau, and how this combination can solve your data visualization challenges.
Picture this: you’re drowning in a sea of data, struggling to make sense of it all. That’s where using Tableau with Splunk comes to the rescue. Splunk, a leading data analysis platform, seamlessly integrates with Tableau, a renowned data visualization tool. Together, they provide a comprehensive solution for businesses seeking to derive actionable insights from their data.
Did you know that businesses leveraging data visualization tools are 28% more likely to find timely information compared to those relying solely on spreadsheets? Using Tableau with Splunk, you can join the ranks of these successful organizations, harnessing the power of visual representation to drive informed decision-making.
What is the integration of Tableau with Splunk data about?
Using Tableau to work with Splunk data is a powerful combination that enables users to seamlessly connect Splunk’s robust data analytics capabilities with Tableau’s intuitive visualization features. This integration allows users to effortlessly transform raw data into visually appealing dashboards, charts, and graphs. Tableau caters to a wide range of users, including data analysts, business intelligence professionals, and executives, who can all benefit from its capabilities.
By using Tableau, you can easily translate complex data sets into meaningful visual representations, making it easier for stakeholders to understand and interpret the data in order to make conscious decisions about the next steps that that they should follow to improve every aspect of their business.
The Benefits of using Tableau with Splunk
Leveraging Tableau with data from Splunk brings a multitude of benefits to the table, enhancing data analysis and visualization. The primary advantage lies in its ability to bridge the gap between data analysis and presentation, enabling users to effectively communicate insights to stakeholders. When used together, Tableau and Splunk can enhance data analysis and visualization capabilities. Here’s how they can be used in conjunction:
Data Integration: Tableau can connect to Splunk as a data source, allowing users to extract and analyze Splunk data within the Tableau environment. This integration enables users to combine data from multiple sources, perform advanced analytics, and create comprehensive visualizations.
Enhanced Visualization: Tableau’s rich set of visualization tools can be leveraged to create visually appealing and interactive dashboards using data from Splunk. Users can build custom charts, graphs, and maps to explore and present Splunk data in a more intuitive and user-friendly manner.
Data Exploration: With Tableau connected to Splunk, users can explore and analyze large volumes of data more efficiently. Tableau’s data blending and filtering capabilities can help users identify patterns, trends, and anomalies in Splunk data, enabling them to derive meaningful insights.
Reporting and Collaboration: Tableau provides robust reporting and sharing features, allowing users to create reports and share them with stakeholders. By integrating with Splunk, Tableau can generate reports and visualizations based on Splunk data, helping users communicate insights effectively and collaborate with others.
Overall, the integration of Tableau with Splunk can enhance data analysis, visualization, and reporting capabilities, enabling organizations to derive deeper insights from their machine-generated data and make data-driven decisions more effectively.
How to Use Tableau with Splunk
Now that we’ve covered the benefits of using Tableau with Splunk, let’s delve into how you can effectively leverage this powerful combination.
Step 1: Connect Splunk with Tableau
Begin by establishing a seamless connection between your Splunk instance and Tableau. This ensures that you have access to real-time data for visualization and analysis purposes. Utilize the data connectors provided by Tableau to integrate with your Splunk environment effortlessly.
Instructions for connecting Tableau to Splunk are here: https://help.tableau.com/current/pro/desktop/en-us/examples_splunk.htm
Step 2: Explore Data and Create Visualizations
Once the connection is established, you can start exploring your data using Tableau’s intuitive interface. Create visually appealing dashboards, charts, and graphs to present your data in a compelling manner. Leverage Tableau’s drag-and-drop functionality to select data fields, apply filters, and customize visual elements according to your requirements.
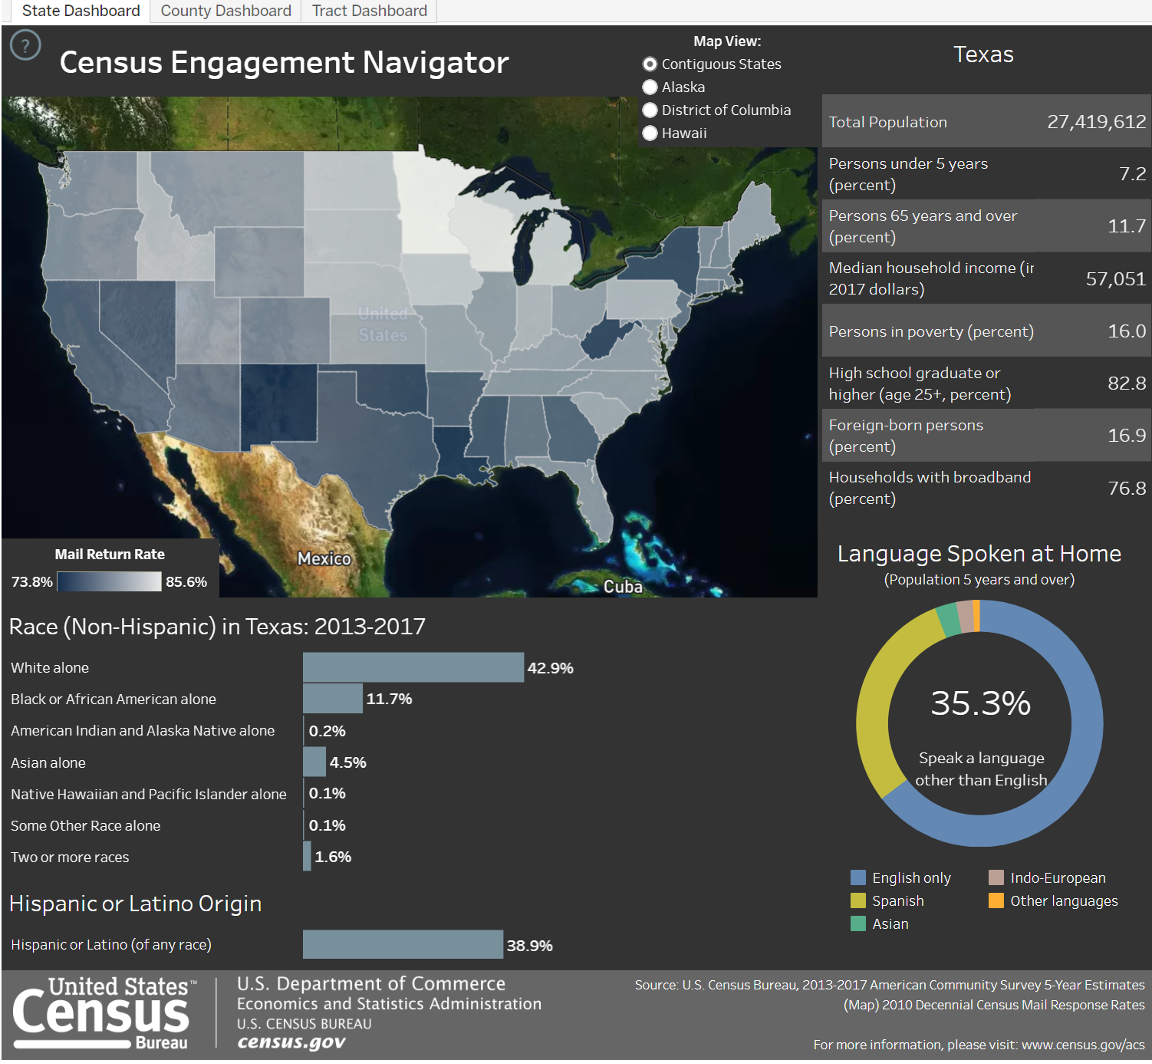
Image from: https://www.tableau.com/data-insights/dashboard-showcase/explore-nationwide-us-census-engagement
Step 3: Analyze and Share Insights
With your data visualizations in place, it’s time to dive into deeper analysis. Utilize Tableau’s powerful analytical capabilities to perform calculations, apply statistical models, and gain deeper insights from your data. Once you’ve extracted meaningful insights, you can share them with stakeholders by publishing your dashboards or reports securely.
Conclusion
In conclusion, using Tableau with data from Splunk is a powerful combination that enables businesses to transform complex data into meaningful visualizations. By seamlessly connecting Splunk’s data analytics capabilities with Tableau’s intuitive visualizations, users can unlock valuable insights, tell a compelling story, and make informed, data-driven decisions that provide tangible value.
If you found this helpful…
You don’t have to master Splunk by yourself in order to get the most value out of it. Small, day-to-day optimizations of your environment can make all the difference in how you understand and use the data in your Splunk environment to manage all the work on your plate.
Cue Atlas Assessment: Instantly see where your Splunk environment is excelling and opportunities for improvement. From download to results, the whole process takes less than 30 minutes using the button below: