If you’re responsible for monitoring your company’s systems, software products, and networking environment, you might have come across two powerful tools: Splunk and Kibana. Splunk is a well-established tool, while Kibana is relatively new to the industry, but both are equally compelling. You may be wondering what the differences are between them.
Evaluation of Splunk vs Kibana
This blog provides a brief comparison of both Splunk and Kibana based on their installation and authentication features, as well as Splunk’s differentiators. Our aim is to highlight the benefits, pitfalls, features, and use cases of both products for consideration. Splunk differentiators are capabilities that set them apart from the competition. They reference them as Any Data Structure, Source, Timescale, Insight, Action, and Cloud. The Splunk Sales team will say we can do all six, so let’s examine how Kibana matches up.
What is Splunk?
Splunk is a powerful log file management tool that offers a suite of Apps and APIs that provides capabilities to perform System Information Event Management (SIEM), Security Orchestration, Automaton and Response (SOAR) and Observability solutions.
What is Kibana?
Kibana is a graphical application that works with Elastic Stack to provide data visualizations for indexed data in Elasticsearch. Elasticsearch is a distributed search and analytic engine used for log analytics and text search. Kibana provides the user interface on top of the Elastic Stack (Elasticsearch, Logstash and Kibana) for performing monitoring, managing, and security capabilities for Elastic Stack.
Installation
The base component for a Splunk installation is composed of two main binaries: Splunk Enterprise and Splunk Universal Forwarder. These solutions can be used together to create a Splunk deployment in various configurations, including Stand-alone, Distributed, Distributed Cluster, Search Head Cluster, and Multi-Site clusters.
Kibana is comprised of four main components: Elasticsearch, Logstash, Kibana and Beats. Elasticsearch can also perform clustering and data replication. By default, a single instance of Elasticsearch is a cluster of one. As new nodes join, the cluster automatically reorganizes itself for performing even distribution of data.
A significant advantage of Splunk is that for indexing and searching, an on-premises solution may only require a self-contained installation of Splunk Enterprise and a Universal Forwarder agent on the monitored host to collect and forward log data to the indexer(s). Kibana is easy to install but may require dependencies like JAVA.
Authentication
Both Splunk and Kiana can provide Basic, LDAP, or single-sign-on like SAML authentication. Additionally, both can secure their http web traffic using an SSL certification.
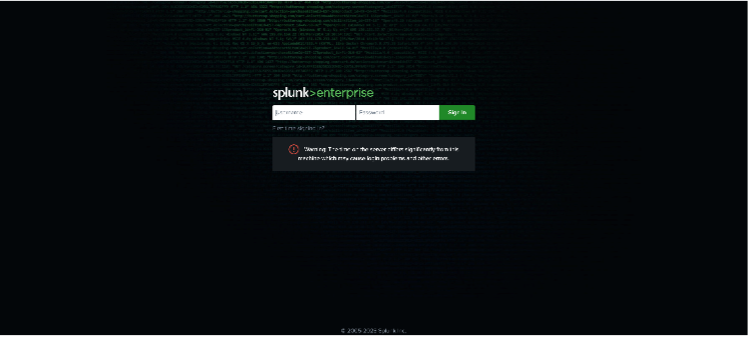
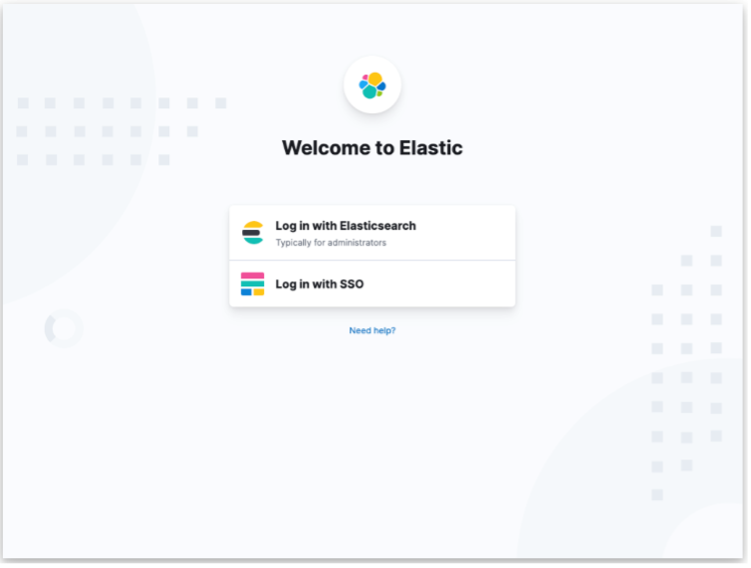
Below is Splunk basic sign-in view followed by Kibana’s sign-in view.
Splunk Login Page.

Kibana Login Page.

Splunk Differentiators
Splunk has six differentiators that set them apart from the competition: Any Data Structure, Source, Timescale, Insight, Action, and Cloud. Let’s examine how Kibana matches up to these differentiators.
Any Data Structure
“Any Data Structure” is a term used by Splunk to refer to its ability to ingest and understand all data regardless of the host, application, or network system. Log formats can be in the format of single-line text based, multi-line text based, structured data such as JSON, XML, CSV, or data from a database.
Kibana primarily received its data from Elasticsearch, a distributed search and analytic engine used for log analytics and text search. Elasticsearch is also capable of handling formats such as single-line text based, multi-line text based, structured data such as JSON, XML, CSV, and logs from a database.
Any Source
Splunk boasts the ability to get data easily from anywhere: any host, server, network appliance network, cloud source (private, public), or Industrial IoT (Internet of Things) device. To achieve this, Splunk uses an agent called the Universal Forwarder to monitor log data from any source. It also can poll for data from REST API inputs, receive data through a HTTP Event Collector, and pull data from database sources using JDBC connectivity.
Kibana mainly relies on Elasticsearch to obtain its data. A single data source does not sound too exciting until you understand that Elasticsearch is used by more than 3900 companies including Uber, Shopify, and Udemy. There are several options for getting data to Elasticsearch, such as Elastic Agents which collect metrics from hosts, Beats processors that collect and send certain types of data from a server, and Logstash which is an opensource data collection engine that supports a wide variety of data sources.
Any Timescale
Splunk’s key advantage in terms of Timescale is the ability to look back in time at historical data, as well as view near-real-time data. Being able to examine historical data across data sources is essential for analysis and investigations while viewing real-time streaming data is essential for instant response actions. Splunk provides several methods for efficiently viewing data as far back as desired, including TSTATS searches, Report Acceleration, and Data Model Acceleration.
Kibana utilizes a feature in Elastic called Rollup for handling historical data. Rollup compresses stored historical raw data into a reduced granularity format. Additionality, Elastic provides features called “search endpoints” that enable searching over rolled-up data. These features provide the capability to inspect rolled-up and live data seamlessly, using a single query. Real-time searching in Elastic incorporates a feature called ‘Refresh.’ Refresh is a Lucene (Java libraries on which Elasticsearch is based) process where information buffers are written to cache and made available for searching, but not yet committed to index for storage. This provides what is called “near real-time search,” within one second.
Any Insight
Splunk boasts a capability known as “schema-at-read,” which provides the ability to correlate and analyze disparate datasets and provide insights across multiple use cases. Schema-at-read gives the ability to structure data (parse and extracted key fields) when it is searched, as opposed to when it is indexed. Correlating and analyzing different datasets is possible via Splunk’s rich querying library, known as Search Processing Language (SPL). This rich functionality allows Splunk to support use cases for Security, IT Operations, App Development, Infrastructure, Cloud, and much more.
Kibana, which lives on top of the Elastic Stack, can also parse and extract fields at search time known as “scripted fields,” which incorporates schema-on-read capabilities. Elastic allows finding transaction latency and failure correlations by correlating events from a piece of hardware or a set of users with latency issues on IP addresses. Kibana use cases include log monitoring and extensive visualization capabilities for application performance monitoring (APM), Anomaly Detection, and more.
Any Action
Actions are the natural response to an alert. For example, if an alert detects a breach, the corresponding action might be to seal the breach by closing a port or shutting down a system. Splunk boasts the ability to not only act on an alert but, also forecast the possibility of an alert. Splunk provides the ability to respond to alerts using SOAR playbooks. Splunk uses Machine Learning and risk-based alerting to model risk scores from many sources to provide insight into future activities that require action. This feature is found in Splunk’s ITSI products for Observability, Enterprise Security, and other premium apps.
Kibana supports defining rules to trigger actions when certain conditions are met. These actions can involve other services or third-party components via connectors. An example might be a third-party email service that sends notifications that a trigger condition was met
Any Cloud
Finally, Splunk has the ability to deploy in, monitor, and secure any public or private cloud including AWS, Microsoft Azure, Google Cloud, as well as GovCloud and FedRAMP services.
Kibana can run on any cloud hosting Elasticsearch. Elasticsearch can run on AWS, Microsoft Azure, and Google Cloud. It is also FedRAMP authorized and deployable to GovCloud (US).
Conclusion
Splunk is a well-known, well-established machine data collection and analytics tool. It offers a powerful set of features for Cloud and on-premises solutions, albeit at a price and an elevated level of complexity. Kibana is a great monitoring tool, has easy-to-use interfaces and is flexible and easy to setup. Splunk is licensed software and charges a fee, Kibana is completely open-source and available at no cost.
If you found this helpful…
You don’t have to master Splunk by yourself in order to get the most value out of it. Small, day-to-day optimizations of your environment can make all the difference in how you understand and use the data in your Splunk environment to manage all the work on your plate.
Cue Atlas Assessment: Instantly see where your Splunk environment is excelling and opportunities for improvement. From download to results, the whole process takes less than 30 minutes using the button below:


