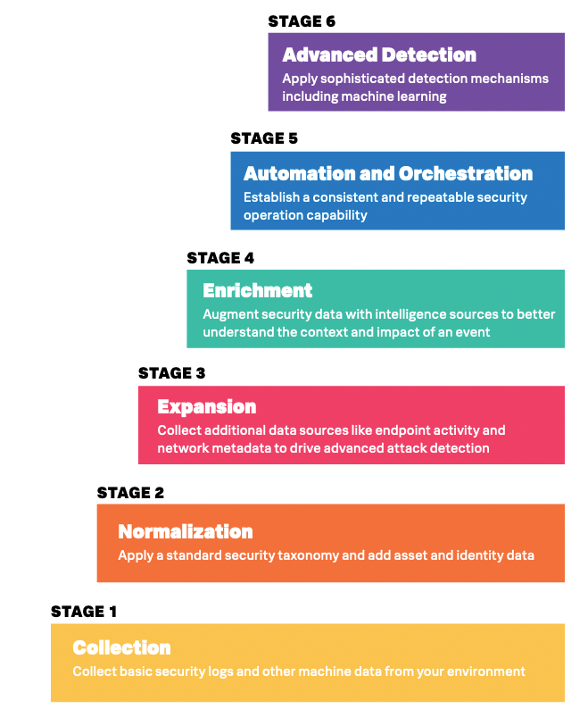
With cyberthreats of every kind emerging daily, you may be asking how you can defend your organization’s data and proactively identify and mitigate new challenges. Splunk has put forward a six-stage security journey to provide guidance:

Every beautiful dashboard and impressive visual Splunk is capable of producing is, ultimately, driven by two things: data and search. And while search is the primary driver behind the analytics and visualizations in Splunk, all the perfectly written and executed searches in the world can’t help you if you’re missing the most important resource of all — quality data.
The same is true of your security use case.
If you’ve ever put together a Lego® set, you know you’ve got to have all the pieces if you’re going to be able to build the Lego Death Star. Even one missing piece could leave you frustrated and incapable of building what you set out to create. So whether you’re using Splunk for incident investigation and forensics, security monitoring, advanced threat detection, or SOC automation, your security journey begins with this critical step:
You have to collect basic security logs and mission-critical machine data from throughout your organization’s environment.
While these practices are going to look different from organization to organization, there are some fundamental components that will build a solid foundation for your security infrastructure:
Network Data Sources
The ability to monitor and analyze network traffic is critical for any team, regardless of your security use case. In the data collection phase, you should be most concerned about your ability to have “eyes on” traffic that is entering and exiting your network. Of course, you also want to be able to identify traffic that was blocked and denied entry.
As an example, network data sources might include firewall traffic logs from companies such as Cisco, Fortinet, and Palo Alto Networks (among others).
Internet Activity Data Sources
Many cyberattacks start with an inside user visiting an infected website either directly (they clicked a link online during a search, for example) or via email. These malicious sites may provide bad actors with access to valuable user or company information, or open the organization to malware or ransomware attack. Having access to a log of visited websites is critical during investigation of a security-related incident.
Important sources to ingest might include next-generation firewall (NGFW) traffic filters or proxy logs from sources such as: Bluecoat, Cisco, Palo Alto Networks, and Websense (again, among others).
Endpoint Data Sources
Logs from endpoint data sources work hand-in-hand with your network data sources to provide valuable insights into attack activities such as malware execution, unauthorized access attempts from an insider, or attackers “lying in wait” on your network. You’ll want to capture data from your individual workstations, organization servers, and operating systems.
Examples of this type of data source would include Windows event logs, MacOS system logs, and Linux system and auditd logs.
Authentication Data Sources
Utilizing authentication logs will allow you to not only see that unauthorized access has occurred in your system or applications, but where the access was attempted from, and when. Having access to this data allows you to tell whether a login attempt is valid or potentially a bad actor.
Windows Active Directory, MacOS system logs, Linux auditd, and local authentication are examples of this type of data source.
Then What?
As with most things, this step of the journey is the most important, but also the most time-consuming, tedious, and — frankly — painful. Because of this, many organizations miss critical pieces or gather insufficient information. At Kinney Group we operate by a guiding principle:
Bad data is as bad (or worse) than no data.
If you’re at this stage of the journey (or revisiting this stage), take your time, slow down, and be thorough. Beyond that, make sure your critical logs live in a separate system that can’t be easily accessed by an attacker.
Need help to be sure you’re collecting the right data sources and setting your organization up for security success with Splunk? We’d love to chat.
One more thing…
Once you have your data sources identified and “reporting in” to Splunk, you need to make sure they continue to report and that you’re alerted if a source drops offline. While it’s possible to create these alerts and reports manually, we’ve developed applications that make defining your data sources, setting up alerts, and monitoring data sources and forwarders push-button simple as part of the Atlas Platform for Splunk.
We’d love to show you the solution and answer any questions you may have, or you can get started with a free 30-day trial by clicking the link below.


