

What is Splunk Diag?
Splunk diag (also known as “Splunk Diagnostic File”) is a diagnostic report. It is used to disseminate system information and logs from a Splunk deployment. A diag can be run on all nodes within a Splunk deployment, including indexers, search heads, and forwarders.
A Splunk diag collects various types of data including log files, app configuration settings, lookups, key-value (KV) stores, the contents of the $SPLUNK_HOME installation path, search peer info, operating system version information, server specifications, file system information, current network connections, index metadata, and more. The output is a compressed file that can be uploaded to Splunk Support or analyzed locally by system administrators to troubleshoot issues.
Indexed data isn’t collected and stored during the diag collection process, and a lot of what is presented depends on the servers connected to your Splunk instance. Splunk diag is often used as a first step in troubleshooting complex issues in a Splunk deployment, as it provides a comprehensive snapshot of the system at a given point in time.
How to Generate a Splunk Diag
There are two ways to generate a diag in Splunk: The GUI method and the CLI method.
Option 1: The GUI Method
Step 1: Click RapidDiag.
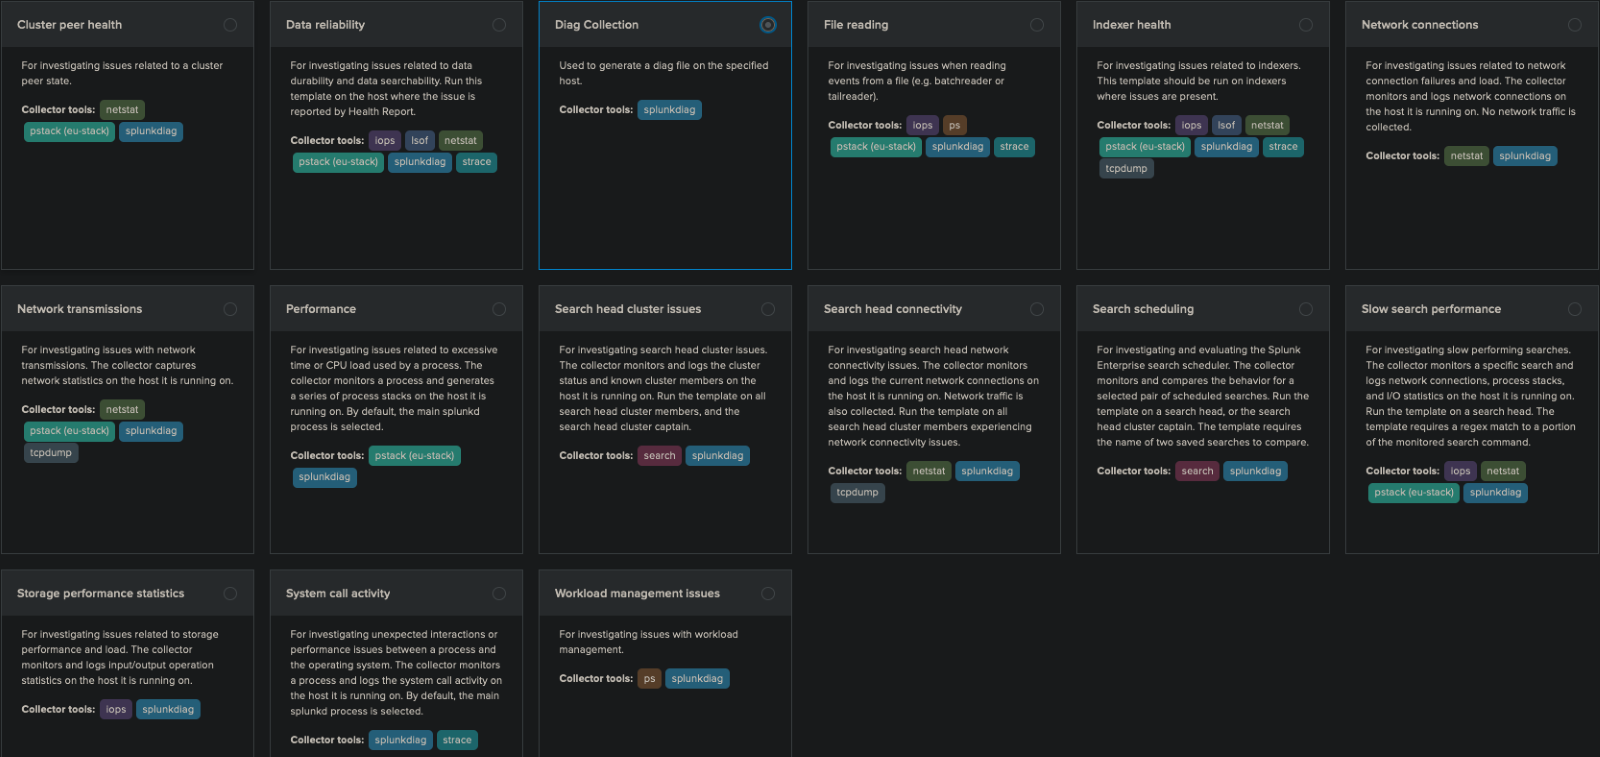
You’ll see three tabs and fifteen templates. Each box contains information on what each template does.
The Collector tools will show more information on what is added on top of the standard splunkdiag seen on Diag Collection.
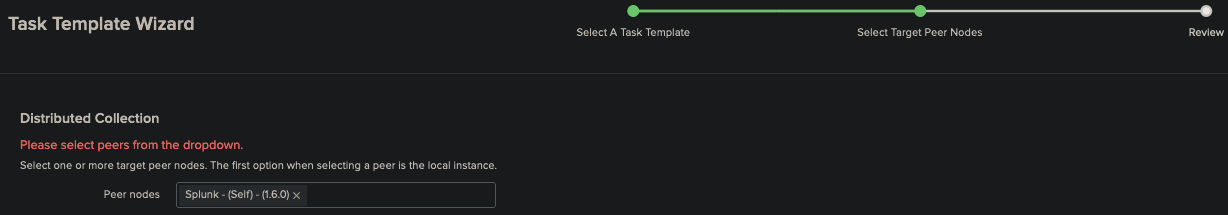
Step 2: Choose which peer node to view.
This box has a dropdown that should show all available peers connected to this instance. If nothing is connected “Splunk – (Self)” shows information on the current running instance you are connected to.
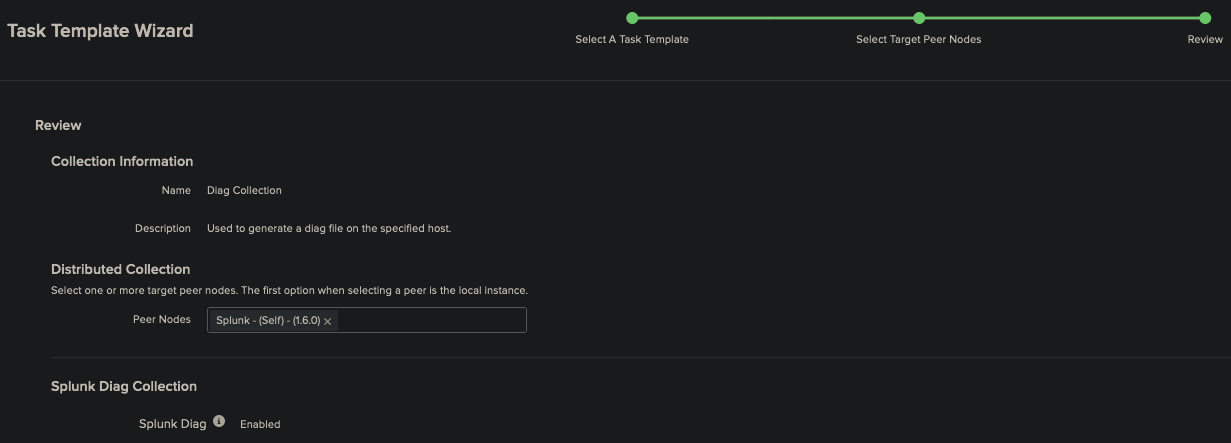
Step 3: Finally you end on the Task Manager tab, which shows some information on the running diag. After this has completed you are shown the location of the diag on your splunk server.
Moving into the listed directory under output file shows a .tgz file. Also in this directory is a folder with the same name. This is so when untaring the file it is naturally dropped into that folder. Once there the new name prefix is changed from rd (rapid diag) to diag. Finally in this folder you will find the information from you diag. If you don’t need to view it the .tgz is compressed and ready to send or upload.
Option 2: The CLI Method
The CLI version of creating a diag covers a lot of different options beyond what has been covered under the GUI method above, and it goes into more detail regarding what can be added or removed from a diag.
Step 1: Open a terminal window to the Splunk bin directory ($SPLUNK_HOME/bin).
Step 2: Run the splunk diag command with options to specify the type of information you want to gather.
Information about the Splunk system would use the –system option:
./splunk diag –system
This will gather a variety of information about the Splunk system, including the Splunk version, the operating system, the system architecture, among other items.
Step 4: To gather information about the Splunk configuration, including the server.conf file, web.conf, and the indexes.conf file, you can use the -config option, like this:
- “./splunk diag –config”
Step 5: To gather information about the Splunk logs, including the splunkd log, the metrics.log log, and the splunkweb_access.log log, you can use the -logs option, like this:
- “./splunk diag –logs”
Step 6: If a case file is already opened you can use the command to upload it to Splunk as well:
- “./splunk diag –upload”
With these options, the “./splunk diag” command supports a variety of other options that allow you to gather more information. You can use the -help option to see a list of all the available options.
If you found this helpful…
You don’t have to master Splunk by yourself in order to get the most value out of it. Small, day-to-day optimizations of your environment can make all the difference in how you understand and use the data in your Splunk environment to manage all the work on your plate.
Cue Atlas Assessment: Instantly see where your Splunk environment is excelling and opportunities for improvement. From download to results, the whole process takes less than 30 minutes using the button below:


