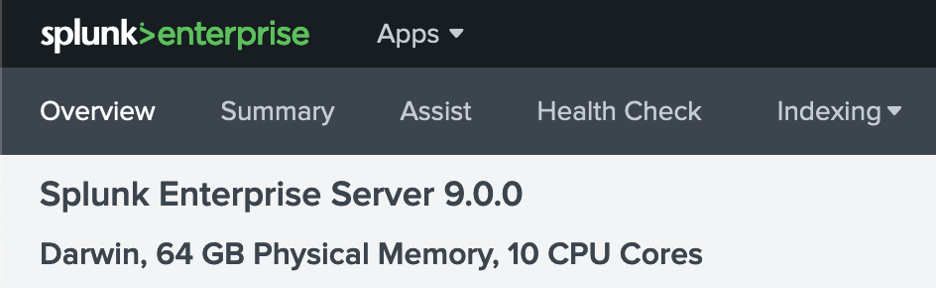
The wait is over and Splunk 9 is officially here! This release introduces a number of features and improvements aimed at making life easier for Splunk admins and users alike. Wondering which announcements and improvements really matter for you? Join us as we investigate and explore some of our favorite discoveries!
Splunk Assist in Splunk 9
Splunk 9 brings with it Splunk Assist, an exciting improvement to the Monitoring Console for On-Premises Deployments, helping Splunk Admins configure and secure their Splunk Environment faster than before!
Assist is a brand-new tab and suite of functionality for the Monitoring Console. It can be easily reached from the Monitoring Console’s navigation in Splunk 9.
So what does Splunk Assist bring to the table?
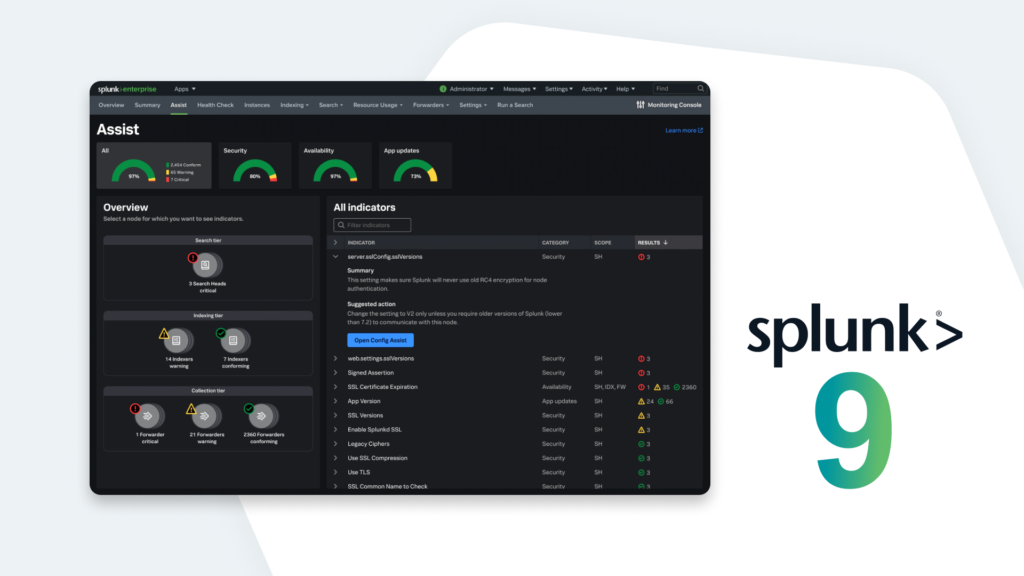
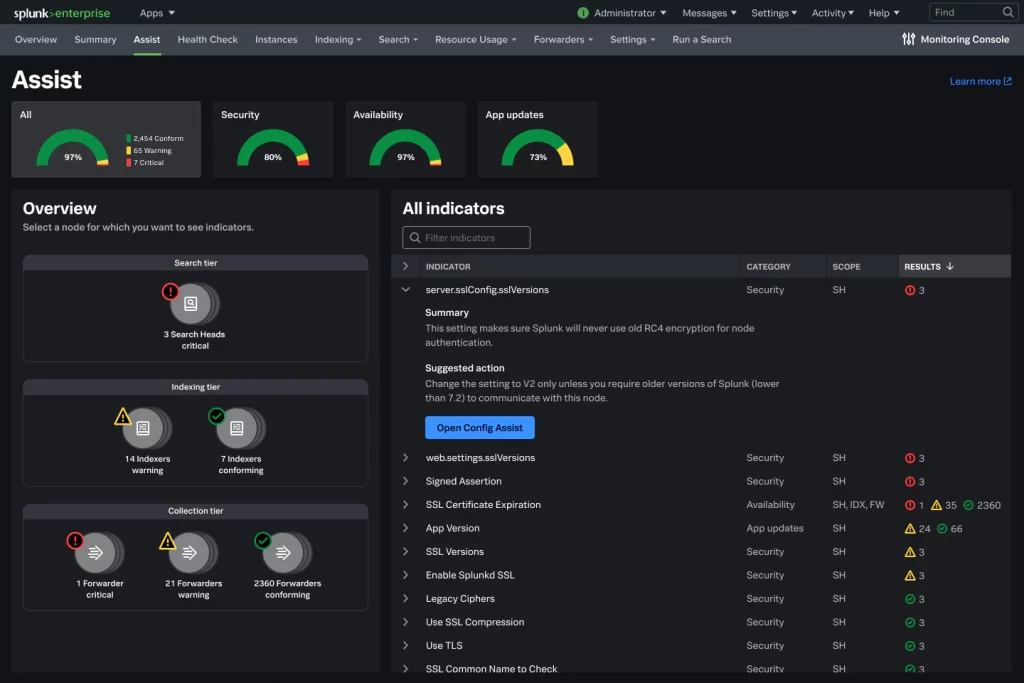
First, the primary Splunk Assist pane provides insights, grouped into three distinct areas:
- Indicator Tabs: These are categories of indicators for which you can see additional information. Clicking on one of these tabs loads information about that indicator, including a graph with the number of instances in your deployment, and what their compliance status is (conforms, warning, or critical).
- Overview Pane: Provides detailed information about the nodes in your Splunk environment. Status icons here also reflect their compliance status, and are grouped into search, indexing, and collection tiers.
- Indicator Summary: This pane provides a list of all the indicators along with a summary of the information it collects, and why. You’ll see information relative to the indicator’s category, scope (where does the indicator apply), and results (compliance state).
Splunk Assist also tracks and visualizes SSL certificate best practices. This ensures your Splunk ecosystem is meeting security standards by clamping down on possible attack vectors, while also ensuring that expired SSL certs don’t creep up on a busy IT team.
What’s the catch?
This is incredible functionality, but it does come with a catch — Splunk Assist requires Splunk admins to leave Support Data Usage turned on in their environment. This will enable Splunk HQ to start investigating and tracking your Splunk environment data to find potential issues. While this won’t send your private event data upstream to Splunk, it does require outbound connections that many on-premises installations may lack.
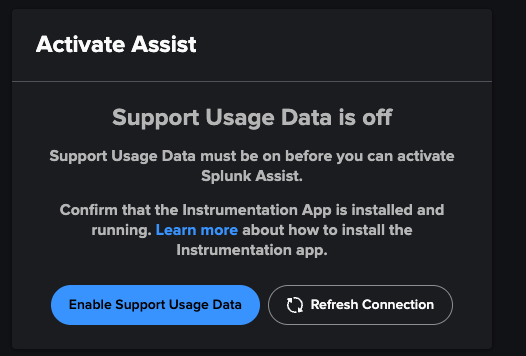
Note: As with Splunk 8, Data Collection is switched ON by default when you install. You’ll need to manually opt-out if you don’t want to share your usage data with Splunk. If you opt-out, the Splunk Assist service won’t work.
Get Started with Monitoring Console
First, you’ll need to prepare your environment: You’ll need to enable support usage data, as previously mentioned, to get the insights that SA provides. (http://docs.splunk.com/Documentation/Splunk/9.0.0/Admin/Shareperformancedata) You’ll also need to make sure you’ve configured Monitoring Console, if you haven’t already. If you’re utilizing a firewall, make sure you allow *.scs.splunk.com on Port 443.
Next, you’ll activate Splunk Assist. From the system toolbar, choose Settings > Monitoring Console, and then choose Assist. You’ll need an activation code, which is tied to your Splunk license. If you’re not the license owner, you’ll need to reach out to get this code. If you’re the license owner and you’re thinking, “Uh… I didn’t get a code,” no worries — follow those same instructions, but choose the “Get an activation code” link.
The setup is very straightforward. Once you’ve activated Splunk Assist, it’s time to start using it! We’ll take a deeper dive into how to get the most value from Splunk Assist soon.
What’s next?
This is just one of the many incredible new features available in Splunk 9! Need to get up and running with Splunk 9 quickly? Our expertise (nearly 700+ Splunk engagements over the years) coupled with Atlas — The Creator Empowerment Platform for Splunk — means we can make your transition to Splunk 9 quick and effective!
Check out the Atlas overview video to learn more about empowering your team of Splunk Creators.