

Troubleshooting cloud applications has made security, application performance monitoring (APM), and DevOps impossible to manage. Most cloud providers do not allow you to install your own agents, monitors, or probes on their systems to find out what is going on with their services. So what options are an organization left with?
Many cloud service providers have compromised by providing application programming interfaces (APIs) that can be used to gather data on the health, behavior, and performance of applications and their infrastructure. Prometheus is a popular monitoring tool that uses the pull-based approach to gather metrics from hosts and applications at regular intervals.
What is the Prometheus Node Exporter?
The Prometheus Node Exporter is an open-source time-series monitoring and alerting system for cloud-native environments, including Kubernetes, hosted by the Cloud Native Computing Foundation (CNCF) on GitHub. It can collect and store node-level metrics as time-series data, recording information with a timestamp. It can also collect and record labels, which are optional key-value pairs.
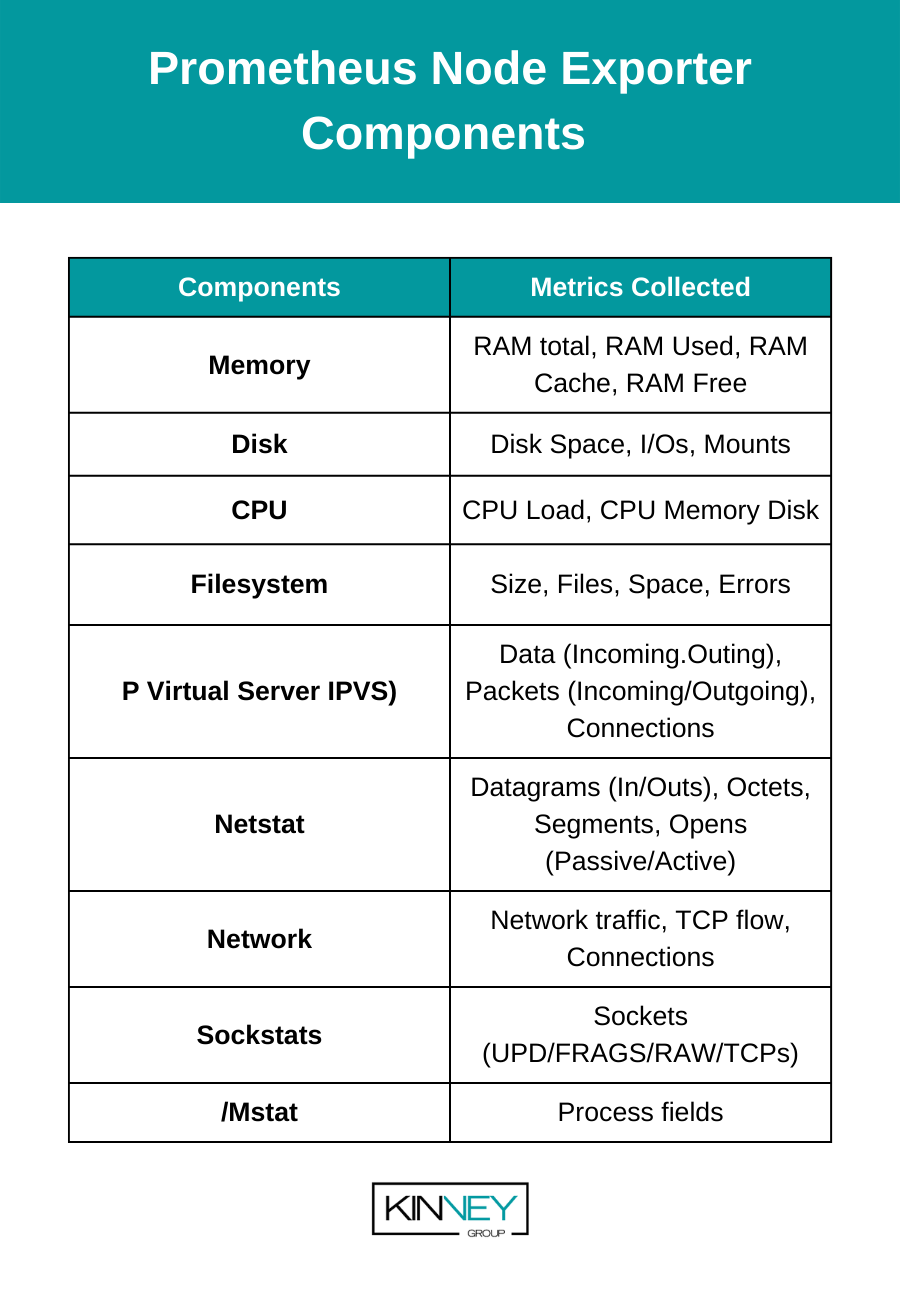
The statistics which are detailed in the table below are used to monitor system performance to avoid slow-down, outages, and troubleshoot node-level issues.
Components of Prometheus
- Nodes: Servers or devices in a larger system that are capable of either sending, receiving, or forwarding information to another member of the system.
- Collectors: Various types of collectors can be enabled to gather the statistics from nodes, containers, and pods.
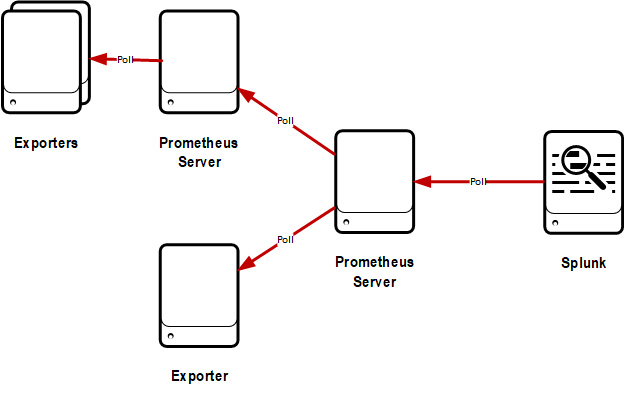
- Prometheus Server: The server is used to configure the data collection specifics via collectors from pods and nodes using a scrape configuration file. It stores data in its integrated local on-disk time series database. It uses a unique query language to aggregate results in real-time. It triggers alerts based on defined conditions.
- Node Exporter: The exporter exposes the metrics via the user interface (UI) and aggregates them in the system’s preferred format.
There are several third-party integrations that allow database, hardware, storage, web, messaging, network, monitoring, logging, and CI/CD metrics to be exported as Prometheus metrics. Examples of these integrations are listed below.
- Hardware: Netgear, Windows, IBM Z, etc.
- Database: MySQL, MS SQL, CouchDB, MongoDB, Oracle, etc.
- Messaging: MQ, Kafka, MQTT, etc.
- Storage: NetApp, Hadoop, Pure Storage, Tivoli, etc.
- HTTP: Apache, Nginx, Squid, etc.
- APIs: Docker, Azure, AWS, GitHub, Google, etc.
- Issue trackers and Continuous Integration: Bitbucket, Confluence, Jenkins, JIRA, etc.
Key Benefits of using Prometheus
- Time Series Database (TSDB): Prometheus is a Time Series Database which can track, monitor, and aggregate metrics over time. Once collected, these repeated measurements can be visualized to show patterns and anomalies.
- PULL Retrieval: Prometheus actively scrapes targets to retrieve system and application metrics from endpoints via HTTP calls.
- Centralized Control: Prometheus is configured on the Prometheus system to determine which metrics to pull from which endpoints and how often to pull them.
- System Discovery: Prometheus can discover new endpoints dynamically and automatically begin collecting metrics.
- Alerting Ecosystem: Prometheus Alert Manager can push alerts designated by custom rules defined in configuration files to specified endpoints.
- Scalable: All single server nodes remain autonomous so data can be sent to various aggregation points as needed. Metrics can be clustered or sent to individual servers based on the configuration of each endpoint.
- Data Visualization: Prometheus allows data to be easily filtered and graphed using the four core metrics types:
- Counter: A cumulative metric whose value can either increase or be reset to zero on restart. It can measure values such as number of requests served, errors, or tasks completed.
- Gauge: This metric represents one numerical value which can arbitrarily increase or decrease. It can measure values such as current memory usage, temperatures, number of currently running processes, or number of concurrent requests.
- Histogram: This metric samples observations and counts them in configurable buckets for such things as request durations and response sizes. A histogram with a base metric name of <basename> exposes multiple time series during a scrape:
-
- cumulative counters for the observation buckets, exposed as <basename>_bucket{le=”<upper inclusive bound>”}
- the total sum of all observed values, exposed as <basename>_sum
- the count of events that have been observed, exposed as <basename>_count (identical to <basename>_bucket{le=”+Inf”} above)
- Summary: This metric is like histogram, but also calculates configurable quantiles over a sliding time window. A summary with a base metric name of <basename> exposes multiple time series during a scrape:
-
- streaming φ-quantiles (0 ≤ φ ≤ 1) of observed events, exposed as <basename>{quantile=”<φ>”}
-
- the total sum of all observed values, exposed as <basename>_sum
- the count of events that have been observed, exposed as <basename>_count
What prerequisites are needed to use the Node Exporter?
- The Prometheus Server (or an equivalent) must be up and running to receive Node Exporter metrics.
- The inbound rules of the Node Exporter must be able to use the HTTP protocol to pull data to an exposed HTTP endpoint.
How can Prometheus metrics be used in Splunk?
To assist Splunk users with the collection of Prometheus metrics, Splunk has integrated the Prometheus Node Exporter into the Smart Agent Receiver of the Splunk Distribution of OpenTelemetry Collector using the open-source Prometheus SDK. The integration replaces a need for a Prometheus Server and the Metrics Proxy and sends the scraped metrics directly to the Splunk Observability Cloud. The monitor is available for Kubernetes, Linux, and Windows. The Prometheus Node Exporter is configured after the Splunk Distribution of OpenTelemetry Collector is deployed.
Once it is installed, you can view your Prometheus metrics using the built-in Observability Cloud dashboard and access the Metric Finder and search for metrics sent by the monitor. You can also view the metrics related to physical servers, AWS instances, virtual machines and other resources related to Infrastructure Monitoring. The default Prometheus metrics types are converted to Splunk Infrastructure Monitoring metrics types as follows:
- Gauges are converted directly to Splunk Infrastructure Monitoring gauges.
- Counters are converted directly to Splunk Infrastructure Monitoring cumulative counters.
- Untyped metrics are converted directly to Splunk Infrastructure Monitoring gauges.
- Summary metrics are converted to three distinct metrics, where <basename> is the root name of the metric:
-
- The total count is converted to a cumulative counter called <basename>_count.
- The total sum is converted to a cumulative counter called <basename>.
- Each quantile value is converted to a gauge called <basename>_quantile and includes a dimension called quantile that specifies the quantile.
- Histogram metrics are converted to three distinct metrics, where <basename> is the root name of the metric:
-
- The total count is converted to a cumulative counter called <basename>_count.
- The total sum is converted to a cumulative counter called <basename>.
- Each histogram bucket is converted to a cumulative counter called <basename>_bucket and includes a dimension called upper_bound that specifies the maximum value in that bucket. This metric specifies the number of events with a value that is less than or equal to the upper bound.
All Prometheus labels are converted directly to Splunk Infrastructure Monitoring dimensions. Service Discovery is supported using discovery rules.
Use Case Examples for Prometheus Node Exporter
1. Service Metrics
Prometheus can scrape metrics from services that run 24/7 via an HTTP endpoint based on specified path, port, and hostname. Prometheus can store that data locally or aggregate it to a central location.
2. Host Metrics
Prometheus can use a special exporter on a host to monitor hardware components such as CPU load and hard disk usage and publish it via an HTTP endpoint.
3. Cronjobs
Prometheus can push the timestamp of the last successful backup job to the Push Gateway via an HTTP endpoint and compare it to the current time in the system. If the time exceeds the specified threshold, the monitor times out and triggers an alert.
4. Website Uptime
Prometheus can use a blackbox exporter to perform an uptime check to gather information on website response time. By defining the endpoints behind the target URL to be queried in the configuration file, you can ensure being notified when the website doesn’t respond.
Conclusion
Prometheus is a tool that keeps expanding to incorporate more formats, exporters, APIs, utilities, and client libraries. As these options become available, so will its usability in Splunk. This blog post only scratches the surface of what can be accomplished using this tool. If you want to learn more or have a specific question, please engage in the comments section of the blog post.
You don’t have to master Splunk by yourself in order to get the most value out of it. Small, day-to-day optimizations of your environment can make all the difference in how you understand and use the data in your Splunk environment to manage all the work on your plate.
Cue Atlas Assessment: Instantly see where your Splunk environment is excelling and opportunities for improvement. From download to results, the whole process takes less than 30 minutes using the link below:


