

Let’s talk about macros. Not the scripts in MS Office often used to execute malicious code, but the little commands that can do big things in Splunk. There’s a good chance you’re already using macros – they’re built into a lot of apps found on Splunk Base and heavily used in the Monitoring Console as we’ll see later. In part one, I want to provide a little primer on what a macro is, show some examples of using macros. In part two, I’ll demonstrate methods to create macros, and talk a little about context and sharing.
What are Splunk Macros?
A macro is a short command that can be used to replace parts of or all of search strings to make your SPL searches shorter and easier to understand. In Splunk terms, macros are Knowledge Objects. You can use macros to search multiple indexes without having to enter “index=a OR index=b OR index=r…” every time. Macros can also be a way to ensure consistency by defining the span used on timecharts.
Macros are more powerful than just being a substitute for part of the search. You can also define parameters on a macro, allowing you to call the macro and pass in other fields or values. This gives you the flexibility to, for instance, calculate current sales in different currencies by setting the exchange rate as a parameter that you enter when running the search. Or filtering to different office locations in the BY field of a stats command.
How to make Splunk Macros
Let’s go ahead and make some macros. We’ll create a few macros through the web interface, then I’ll take you behind the scenes to see what actually happens in the conf files.
Step 1: Switch to the Search & Reporting app and add a macro.
index=_internal AND earliest=-5m AND (log_level=WARN* OR log_level=ERROR) AND sourcetype=splunkd
This search is a bit long, so I’m going to set it as a short macro.
Step 2: Now that we’re in the Search & Reporting app, I’m going to go back to Settings > Advanced Search and click on the “+ Add new” button on the Search macros line.
Step 3: I’ll name the macro “myissues” – that should be a unique name that’s descriptive of its purpose. In the Definition field, I’ll paste in my search from above. We’ll keep it simple for now and not use another of the options to include arguments. Click Save.
Step 4: Now we’ll go back to the Search & Reporting app and use our macro to run a search. Enter `myissues` (remember the backticks) and click the search button.
Splunk Pro Tip: There’s a super simple way to run searches simply—even with limited knowledge of SPL— using Search Library in the Atlas app on Splunkbase. You’ll get access to thousands of pre-configured Splunk searches developed by Splunk Experts across the globe. Simply find a search string that matches what you’re looking for, copy it, and use right in your own Splunk environment. Try speeding up your search right now using these SPL templates, completely free.
Run a pre-Configured Search for Free
How to Add Parameters to Your Macro
What if the issue isn’t caught in Splunk? What if it occurred more than 15 minutes ago? Or less than 15 minutes ago in a large environment so I want to restrict the time and speed up results? Sure, you can use the time picker, but where’s the macro fun in that? Let’s add some parameters to our macro to make it more useful.
Step 1: Going back to the Advanced Search settings, I’m going to click the Clone button to create a copy of my macro, then edit that clone. This time, I’m going to give my search a unique name and add “(2)” to the end of the name, indicating that it will expect two arguments.
Step 2: Next, in the Definition field, I’m going to tokenize the search so Splunk knows where to place the arguments in the search. In the Arguments field, I’m going to list my arguments, separated by commas.
Step 3: Now, I’m going to add a little validation to this macro. The timeframe submitted should be a number here. Any text would cause the search to fail, so before running the search we’ll validate that field is in fact numbers. In the Validation Expression box, I’m going to put a simple eval statement that should return TRUE if the input is correct. If that validation fails, I can write a custom error message to show when the macro runs.
Step 4: Once this is set, click Save.
Step 5: Now go back to the Search app and test it. I’ll search the following, to find web errors in the last 30 minutes: `myissues2(30,splunk_web_service)`
And we get results!
Splunk Tip: You can look at the Job Inspector shows the search expanded with the tokens replaced by my parameters. If you use something other than numbers for the $earliest$ token, you’ll get an error with the message we just set.
Storing Macros in Splunk
Great! Now, if you’re a fan of the command line and get tired of GUI’s, let’s look behind the scenes. If you’re not interested in how Splunk actually stores macros, then jump ahead.
OK, we know that most of Splunk’s knowledge objects and settings are stored in .conf files, and so it’s no surprise that macros are in a file called macros.conf. Macros are user-level knowledge objects, at least when you create them in the web interface. Since I was logged in as admin and working in the Search & Reporting app, I’ll navigate to /opt/splunk/etc/users/admin/search/local to find my personal configs for that app.
cat’ing the macros.conf file, we’ll see both of my macros in their own stanzas. The settings we provided are now in alphabetical order rather than how we saw them on the web interface, but it should look familiar.
Macros Permissions and Contexts
As mentioned briefly above, macros are privately owned by default – they’re only available to the user that created them and only in that app. In the image below, I’ve logged in as a regular user and tried to run the admin macro created above.
The error is actually really descriptive. We’ll follow instructions and go share this macro as the admin user.
Now, even though this particular macro is more admin oriented and not really useful to most users, I still want to be able to access it across apps. That way I can troubleshoot from anywhere. So it’s back to the Search Macros page under Settings > Advanced Search. Filter for my macros and click the Permissions button.
To make sure I can use this macro in any app context, I’m going to select “All apps” under the “Object should appear in” section. I’ll go ahead and leave the Permissions the same here because a regular user won’t have the right to read the _internal index anyways. But that gets into another discussion of user roles and permissions that’s best left for another post.
Just to check that I can access my macro from anywhere, I’ll switch to another app and try accessing it again. (Don’t mind the blanked out names, this is experimental and not ready for release….yet).
If you still have a terminal open where you just cat’ed macros.conf, hit the up arrow and enter. You can see that the macro we just shared globally is gone. It’s been moved to the search app, in the macros.conf in the local directory. It hasn’t changed at all, but it did find a new home.
Splunk Tip: If you want to see all the macros available to a given user, you can use a simple rest search:
| rest /servicesNS/-/-/admin/macros
This may be more information than you need to see but could help with some admin down the line, so I thought I’d share it.
th admin rights and no risk to an operational environment.
Splunk Macro Examples
All right, now that we’ve briefly acquainted you with macros as a concept, let’s look at some examples. I like to use examples that Splunk users can access right now, without having to download a specific app or dataset, so we’re going to look at the Monitoring Console for most of our examples. If you’re a User or Power User Role, you may not have access to the Monitoring Console. But don’t worry, I’ll use plenty of images so you can see what’s going on and show some other examples you may be able to access as well.
Note: I’m running a simple set up of a single indexer and a single search head, running on docker on my laptop. I’m a huge fan of the Splunk-Ansible project as a tool for Splunk users and developers to experiment with admin rights and no risk to an operational environment.
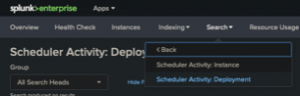
In the MC, I’m going to click on the Search pulldown, then Scheduler Activity and select Scheduler Activity: Deployment.
Find the Skip Ratio Across All Instances panel. Should be second from the bottom on the right side. Mouse over that panel and click the Open in Search button on the bottom right.
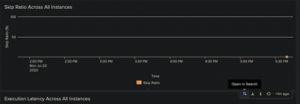
That should open a new tab with the search that populates the Skip Ratio panel. The search you see should look like this:
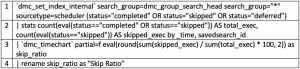
There are two macros you’ll see here and they’re pretty easy to pick out. Each macro, when called in an SPL search string, has to have a backtick at the beginning and the end. Do note that’s not the same as a single quote; this key is usually found at the top left of your keyboard, surrounded by the ESC, Tab, and numeral one (1) keys. So, the first is on line 1 and the second on line 3, `dmc_set_index_internal` and `dmc_timechart` respectively.
But what’s it actually doing? To see that, I’m going to click on Settings > Advanced Search, then choose Search Macros on the page.
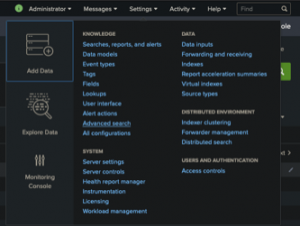
While writing this, my page loads with the Monitoring Console already chosen as the app filter, but you may need to manually set that. Just looking at the summary here, we can see 128 macros owned by the Monitoring Console app (apparently, Splunk Inc. is a fan of search macros).
Searching for the first macro set above, we can see this is simply setting the search to start with “index=_internal”. A very simple macro, I know. But if you filter by the macro name, you’ll see that it’s used in 10 other macros (yes, you can embed one or more macros in another macro). Let’s suppose, just for a moment, that Splunk decides to change that index from “_internal” to “_internals_” for some unknown reason in the future. Changing the definition of this one macro to “index=_internals_” would then update the other 10 macros and the slew of panels that use them. It’s a simple macro that substitutes a small part of a search but can make updating lots of searches and dashboards really simple. Pretty neat.

Now we’ll look at the second macro found above. `dmc_timechart` is a little different than our last example.

It’s another simple macro but used here to set the minspan option of the timechart. As I mentioned previously, this provides a way to have consistency across different panels and searches without having to explicitly set the option in each. And, as simple as it, it appears this macro is used 27 different times[i] in the MC itself. As before, changing this one macro can do a lot.
Now that we’re looking at the macros themselves, scroll until you find the macro called `dmc_tcp_throughput_split_by(2)`. You’ll notice right away this one is a little different, ending with a number in parenthesis. This is an implementation of the parameters that I mentioned above. The number 2 indicates that the macro expects two parameters, and the Arguments column shows that those are “field” and “group”. You can also see the tokens “$field$” and “$group$” in the definition.
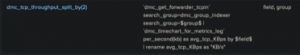
So, if you were to use this macro manually, it would look something like this:
`dmc_tcp_throughput_split_by(<field to replace $field$ token>, <group to replace $group$ token)`.
Until Next Time…
Hopefully, this helps your understanding of macros: what they are, how to create and use them, and how to share them with other apps and users. I’d love to give you a list of custom macros that everybody should have, but every Splunk customer and the user has different needs and different environments.


