

Creating incredible results and outcomes in Splunk requires what we call “data certainty.” Meaning, you know you have all the data you need, and you have a way to be alerted when you don’t (due to a data source going “offline,” for example). All the beautiful visualizations and dashboards and reports you create in Splunk are, essentially, meaningless if you can’t be certain all of your data is being represented accurately — and completely.
If you’re using Splunk for security or compliance, but have critical data streams or forwarders that aren’t reporting, how can you know you’re secure or prove compliance?
If you’re using Splunk for ITOps but missing notable events and alerts, how can you know what to investigate?
You get the idea. Bottom line? Bad data is worse than having no data at all.
![]()
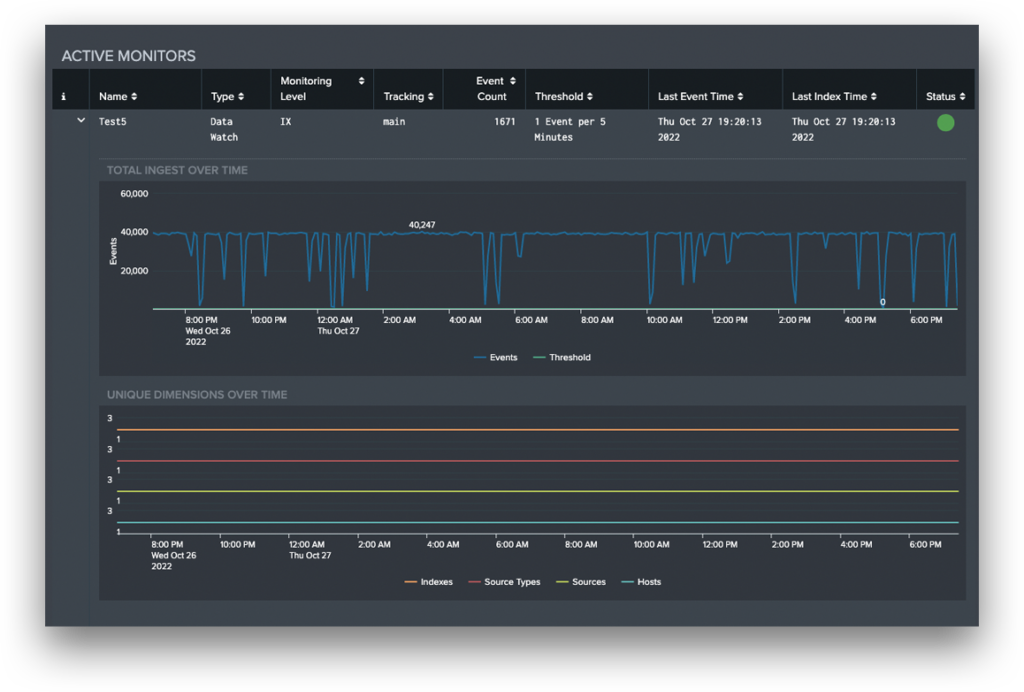
Track and alert on data failures
Splunk admins can utilize Atlas’s simple interface to create “Monitors,” which track and alert on data ingest failures, preventing errors and increasing reliability. Monitors efficiently utilize Splunk resources to do more with less, while providing highly-detailed, proactive reporting (without adding complexity).
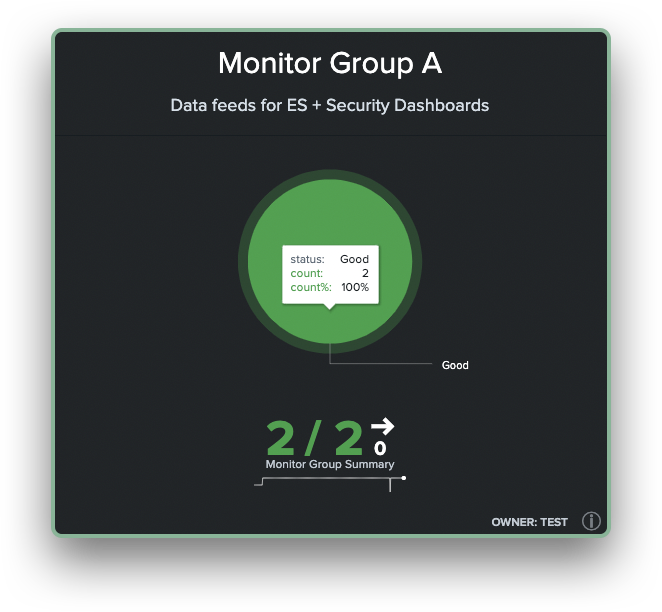
Further, admins are able to create Monitor Groups within the application to consolidate reporting, and can leverage lookup tables and custom searches to make effective use of Change Management Knowledge Objects. With Atlas Monitor, admins have a powerful tool that will increase data flow stability and awareness.
Monitor Capabilities
- At-a-glance summaries to empower creators to quickly assess data flow health with custom thresholding
- Group related data flows together for visualizations and simplified reporting
- Leverage metric indexes and enhanced searching to reduce resource utilization
- Report on outages to enable historical tracking of downtime
- Automatically send alerts by email when Monitors breach thresholds
- Integrate lookup tables for integrating CMDB and assets & identities files
- Create custom searches to monitor unique data sets utilizing advanced base searches
Now that you know how the Monitor application can take the guess work out of your Splunk data, why not check out our Atlas documentation for a closer look.


