

Splunk is a powerful tool that empowers organizations to analyze and visualize machine data. At the heart of Splunk’s capabilities lies its Search Processing Language (SPL). SPL is the foundation for querying, transforming, and visualizing data in Splunk. Within SPL, the geom command is useful to anyone working with geospatial data. This blog post dives into the significance of the geom command and how to use it effectively. Let’s explore how this command can enhance your Splunk experience.
Understanding the geom Command
Geospatial data analysis is a common use case for many organizations that use Splunk. Enter geom, which enables users to integrate geographic boundaries into their searches and visualize data on maps. This command enriches Splunk searches by providing predefined geographic shapes, such as states, countries, or custom regions. These shapes can be used to create map-based visualizations. The command works seamlessly with other SPL functions to help analysts uncover patterns tied to specific geographic locations. For example, the geom command can map sales performance by state, analyze website traffic by country, or track incident reports within custom regions.
Proper Syntax
Using the geom command requires a clear understanding of its syntax. Here is the basic structure:
| geom <featureCollection> [arguments]
- <featureCollection>: Specifies the geographic dataset to use. Splunk provides several predefined feature collections, such as geo_countries and geo_us_states.
- [arguments]: Optional parameters to refine the output, such as filtering specific shapes.
Example:
| geom geo_us_states featureIdField="state"
This example maps data based on U.S. states. By referencing “state”, the command associates each event within “geo_us_states” with the corresponding state polygon, enabling visualizations like heatmaps or geographical charts. This adds valuable context to your data, helping you identify geographic trends, patterns, or anomalies. The ability to map and analyze data based on location provides deeper insights, such as highlighting areas with high incident frequencies or sales, which can inform better decision-making and resource allocation.
Benefits of Using the geom Command
The geom command offers several advantages in geospatial data analysis:
- Enhanced Visualizations: It brings data to life by overlaying it on geographic maps, making patterns more visible.
- Actionable Insights: Helps identify trends tied to specific regions, enabling data-driven decisions.
- Custom Geospatial Analysis: Supports custom boundaries for unique use cases, such as sales territories or delivery zones.
Example Use Cases
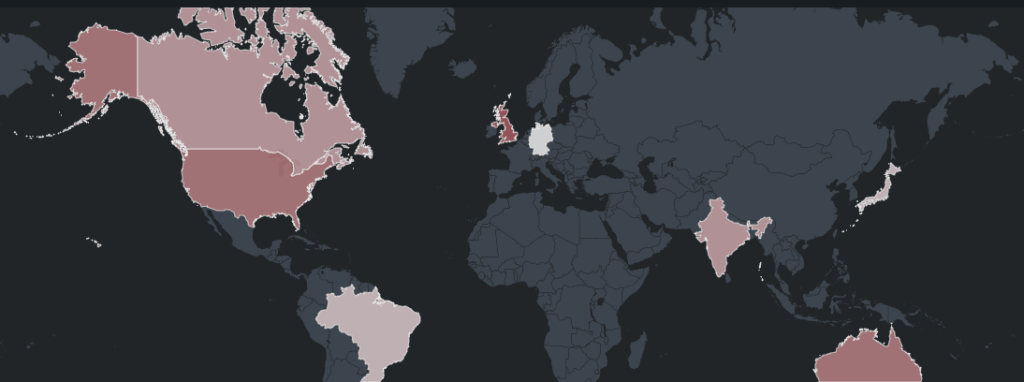
Example #1: Visualizing Website Traffic by Country
Use Case: A company wants to analyze website traffic data by geographic location
					index=web_traffic
| stats count by country
| geom geo_countries featureIdField="country"
Description: This query counts the web packets that have traveled through the network by looking into the web_traffic index. It gets a full count and splits by country to be able to successfully map them onto a world map, giving the user much more in–depth understanding of exactly where the web traffic is originating from.
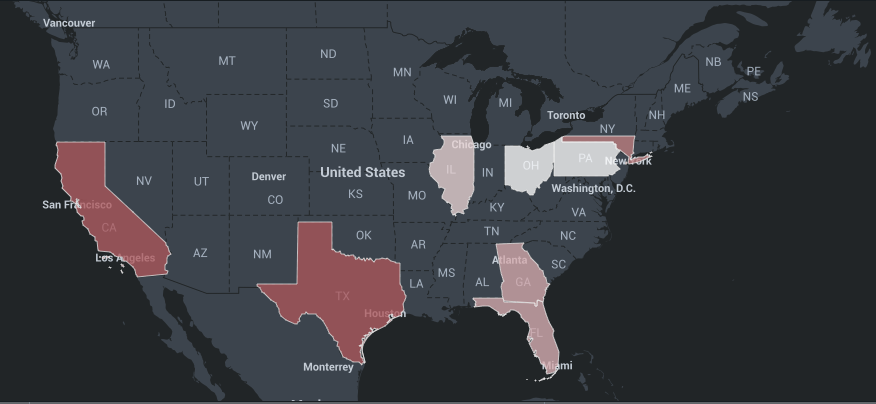
Example #2: Mapping Sales Performance by State
Use Case: A retail chain aims to evaluate sales performance by U.S. location
					index=sales
| stats sum(revenue) as TotalRevenue by state
| geom geo_us_states featureIdField="state"
Description: This search calculates total revenue by state and displays it on a heat map. This provides the marketing and sales departments with valuable information, including the specific states in which they should focus their efforts. This information increases the efficiency of data driven decisions.
Example #3: Incident Report in Custom Regions
Use Case: A logistics company monitors incidents in predefined zones.
					index=incidents
| stats count by region
| geom custom_regions featureIdField="region"
Description: This search tracks incident frequency within user-defined regions, providing indispensable data for a logistics company. This data allows them to narrow down the source of the issue and possibly address it without shutting all operations down.
Conclusion
The geom command is an unparalleled tool for working with geographical data in Splunk. By integrating geom into your searches, it unlocks new ways to analyze and present data. Here are the key takeaways:
- The geom command enriches SPL with geographic visualization capabilities.
- Proper syntax ensures accurate and effective map-based visualizations.
- Using geom can enhance insights, create actionable data, and support custom analysis.
Start incorporating the geom command into your Splunk activities to uncover the hidden potential of your geospatial data!
To access more Splunk searches, check out Atlas Search Library, which is part of the Atlas Platform. Specifically, Atlas Search Library offers a curated list of optimized searches. These searches empower Splunk users without requiring SPL knowledge. Furthermore, you can create, customize, and maintain your own search library. By doing so, you ensure your users get the most from using Splunk.


