

Splunk Enterprise version 9.0 was released on July 14, 2022 during Splunk .conf2022, offering a variety of new features and phasing a few old ones out of service. This article provides a summary of the most significant features of Splunk 9 and why you’ll want to upgrade to take advantage of them.
What is Splunk 9.0?
Splunk is a big data analytics tool used for collecting and searching through machine data. It indexes and correlates information to make it searchable for ad-hoc investigation and troubleshooting, and for use in generating alerts, reports, and dashboard visualizations.
Splunk Enterprise 9 is the latest major version of Splunk, and it includes several new features that Splunk administrators should be aware of and consider in their version upgrade planning.
New Features in Splunk 9.0
Some (but certainly not all) of the most significant and interesting new features in Splunk 9 include:
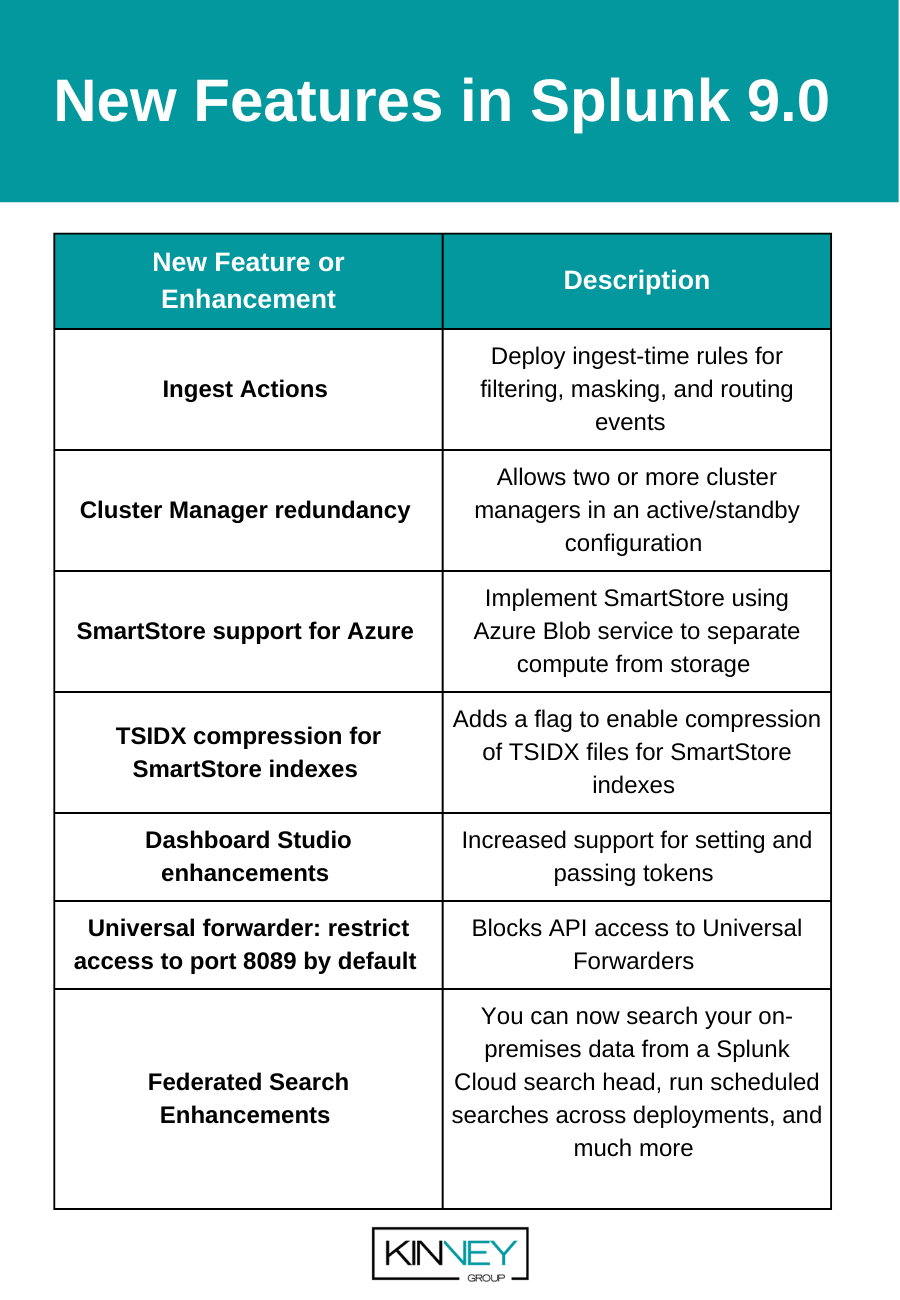
Let’s review these enhancements and why they may be important additions to leverage in your Splunk environment.
Ingest Actions
Ingest Actions is undoubtedly the most exciting new feature in Splunk 9 so we’ll go into more detail on what it is and how to use it.
Ingest actions performs routing, filtering, and masking of data while it is streamed to your indexers. Each data transformation is expressed as a rule; you can apply multiple rules to a data stream and save the combined rules as a ruleset. Note that your indexers must be running Splunk Enterprise for Linux.
You can configure ingest actions using Splunk Web on the cluster manager for deployments utilizing clustered indexers. If you have heavy forwarders configured via a deployment server, configure ingest actions on the deployment server and the rulesets will be deployed to your heavy forwarders that are configured as deployment clients. For standalone indexers or heavy forwarders, configure ingest actions directly on that server. For Splunk Cloud, you can configure ingest actions from your search head. The ruleset will be deployed automatically to the indexers if you have the Victoria Experience; if you have the Classic Experience, you will need to explicitly deploy the ruleset.
Note that you must use the admin role or a role with the list_ingest_rulesets and edit_ingest_rulesets capabilities to configure ingest actions.
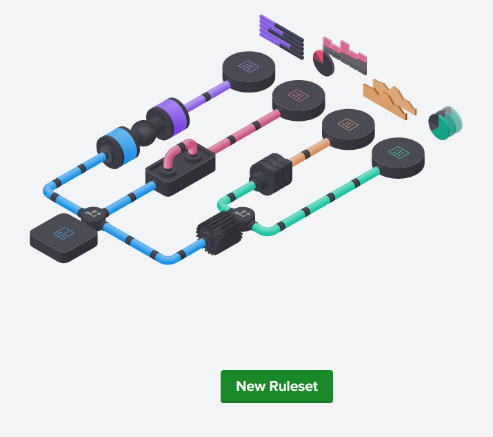
To provide a brief overview of how to configure ingest actions let’s consider the case of a Splunk deployment that includes a clustered indexing tier. On the cluster manager, select Settings > Ingest actions under the DATA column. In the Ingest Actions page, click New Ruleset.
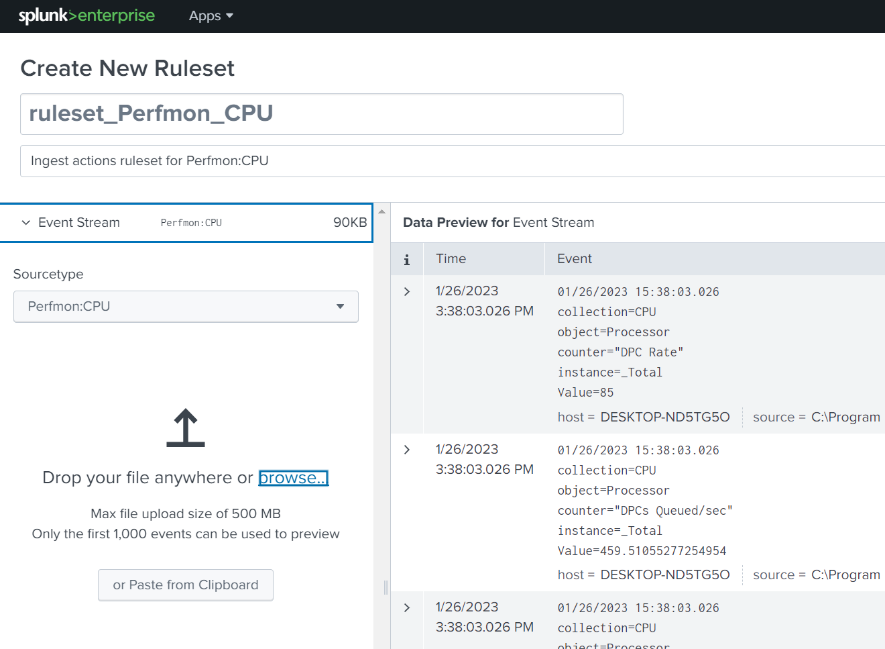
On the Create New Ruleset page, provide a ruleset name and description, then click Select to select the appropriate Sourcetype from the drop-down menus or type in a custom sourcetype. You can select Sample to retrieve some events from indexers, or you will need a sample of the data to be processed – after you’ve selected a sourcetype you can drop a file onto the Splunk Web page, click ‘browse’ and select a file, or copy the sample data to the Clipboard and click the ‘Paste the from Clipboard’ button. The sample data will be ingested and displayed in the Data Preview pane.
Now that you have imported some events you’re ready to create one or more rules. By using multiple rules, you can perform complex modifications to an incoming data source before its data is indexed or skip indexing of some data entirely – you can even route the data to different destinations.
Click the Add Rule button to get started creating a ‘ruleset’ – a set of rules applied to a data source. Note that only one ruleset per source type is supported, and the rules in a ruleset are processed in order.
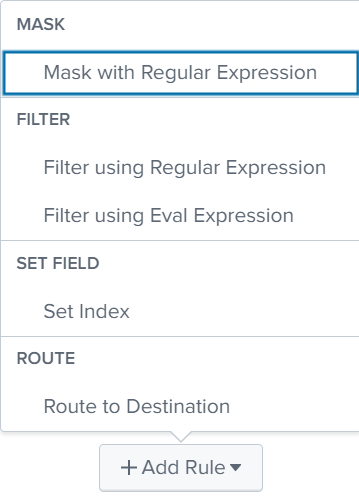
You can select from a variety of rule types, as described below:
Match Regular Expression
The field accepts a regular expression, or a simple string to match in the events.
Replace Expression
The field accepts a string value you want to use to replace any matches.
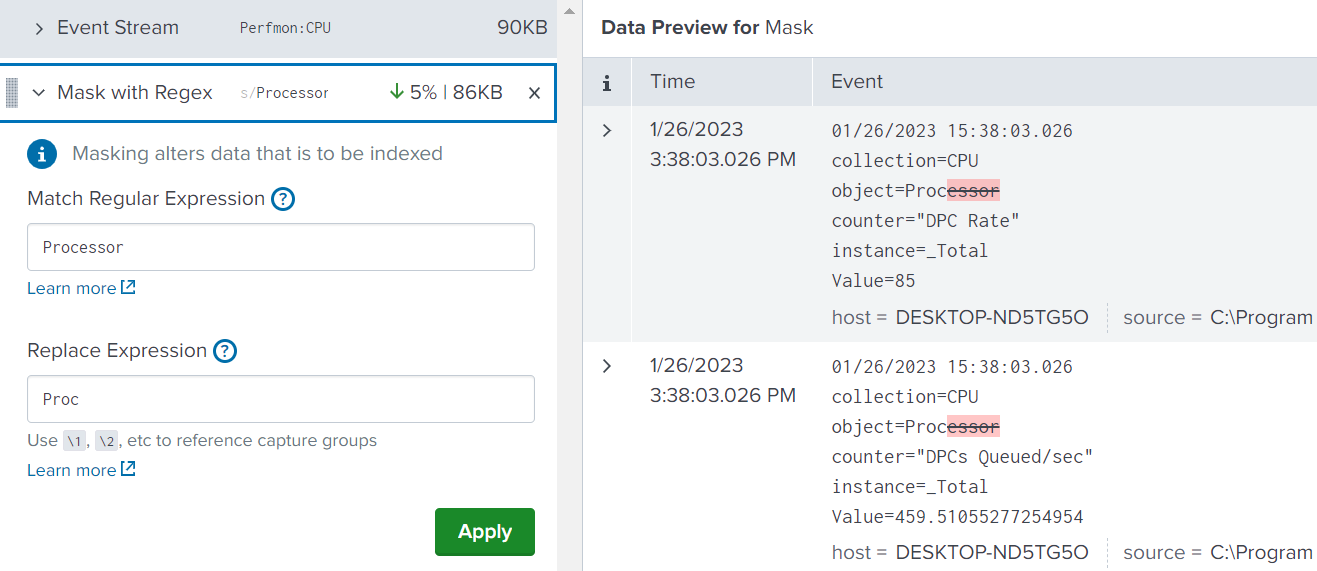
After entering your rule and clicking ‘Apply’ the changes to the events are highlighted. Click ‘Add Rule’ again to add as many more rules as are needed. The other rules provided are:
Drop Events Matching Regular Expression
The field accepts a regular expression, or a simple string to match in the events.
Drop Events Matching Eval Expression
When the eval expression match is true, those events will be dropped.
Set Index
Set the index to a string value (for example, “test_index”) or use an eval expression to determine the index name based on specified conditions. Note that the set index rule affects only events routed to “Default Destination”; it does not affect events that route to S3.
Route to Destination
You can use a routing rule to select events and split or duplicate them between one or more destinations (index or S3). You must choose a Condition (None, Regex, or Eval) to match events with. The default destination is “Default Destination”; events are sent to the Splunk Enterprise indexing queue for processing and on to the applicable index on the local or downstream instance depending on topology.
The destination rule supports AWS S3 and other S3-compliant destinations. If more than one destination is chosen, a copy of any matching events is sent to all destinations specified. The S3 destination must be pre-configured before it can be selected – see the docs for direction.
You can also click the ‘Clone events’ toggle to create a clone of the event stream and apply the current rules, route the stream to a destination, and then apply additional rules against the event stream and route that subset to a second destination.
When you are finished adding and editing your rules you must save the ruleset by clicking the Save button on the top-right. Depending on where you created the ruleset, it is either immediately effective or requires an additional deployment step. Once the ruleset has been deployed, each rule in the ruleset is applied in order to its matching data stream (by sourcetype) before the data is indexed and/or routed.
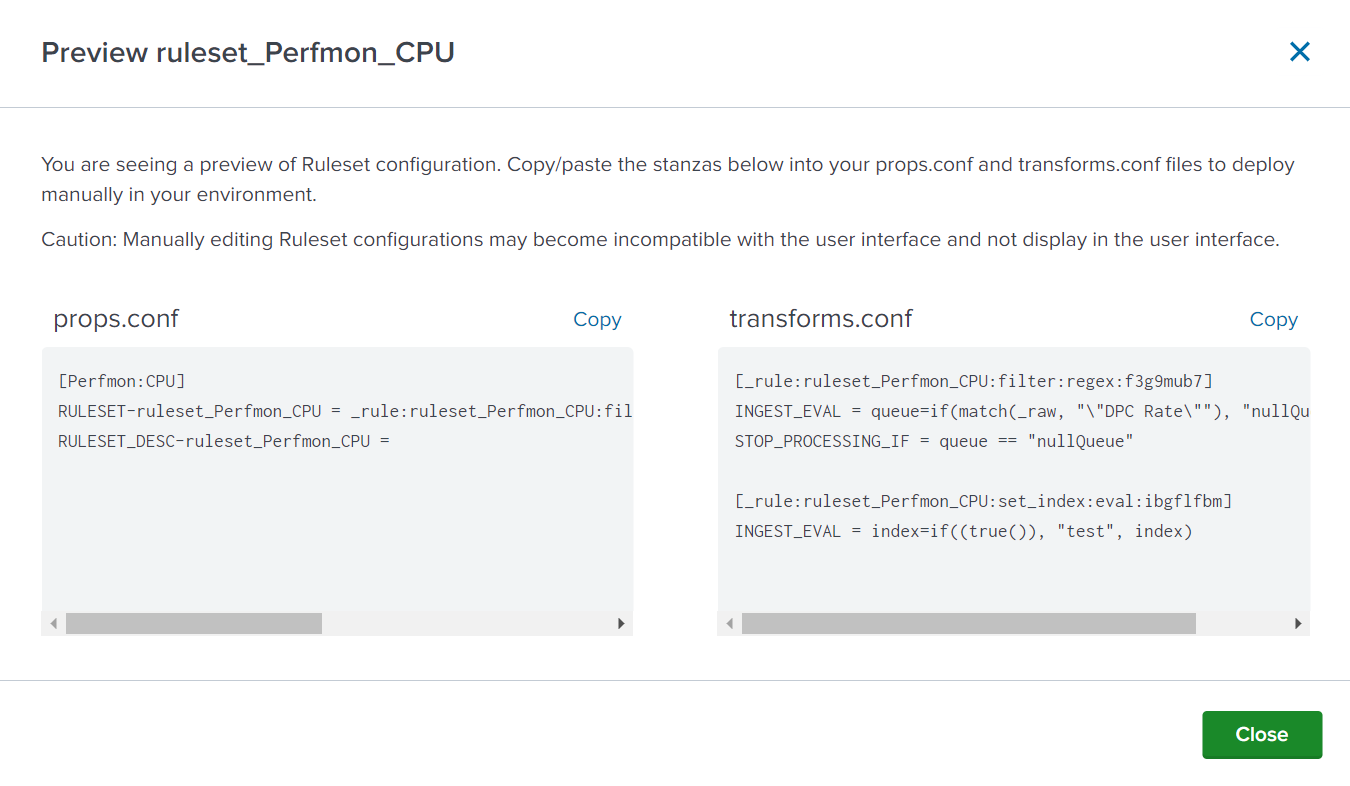
You can view the entries in props.conf and transforms.conf that reflect the rules you created by clicking the ‘Preview Config’ button.
You can read more on ingest actions for additional details on all the powerful options.
Cluster Master Redundancy
Prior to the Splunk 9 release there was no native solution for having a standby cluster manager in case of a failure. With this new capability the active and one or more standby cluster managers continuously sync the state of the cluster so they all have the same configuration bundle, search generation, and peer list such that a fail-over scenario transpires smoothly.
Note that this functionality requires the use of a load balancer to route traffic from indexers, search heads, and forwarders (if using Indexer Discovery) to the online Cluster Manager.
SmartStore support for Azure
Customers running Splunk Enterprise in a BYOL solution on Azure instances can now leverage the SmartStore capability of Splunk to save on storage costs by storing index buckets in an Azure Blob remote store. SmartStore isn’t the best choice for all situations; consult the Splunk docs for guidance.
TSIDX Compression for SmartStore Indexes
Splunk SmartStore functionality can now compress tsidx (time series index) files before uploading them to the remote store using zstd compression. When the files are subsequently downloaded to indexers they are decompressed before saving in the cache. This solution can save on S3 or Blob usage and improve network performance and download transport costs.
Dashboard Studio Enhancements
Enhancements to Dashboard Studio in Splunk 9 bring back some of the advanced features of Simple XML dashboards that are so useful for creating powerful visualizations. These recent additions include:
- Set tokens from search results or search job metadata.
- Set default tokens using the UI or in the source code. This allows you to use search-derived information in other searches or visualizations.
- Link to other dashboards and pass tokens from one dashboard to the next. This supports drill-down capabilities to other dashboards to view and analyze user selected data metrics in more detail.
- Link to a custom URL – relative, such as coming from a local site, or absolute from an external site.
- Updated visualizations – all visualizations have been updated to support setting tokens on a visualization click.
There are quite a number of other interesting enhancements to Dashboard Studio that you can check out.
Universal Forwarder Access Restrictions
Splunk Universal Forwarders have a REST API-based management port capability just as Splunk Enterprise instances do, with a default port of 8089. The ability to execute API calls to UFs is a configuration and security risk, so in Splunk 9 versions of Universal Forwarders this management port has been restricted to just the localhost (127.0.0.1 for IPv4, ::1 for IPv6) so that external servers cannot access the forwarder. This feature can be disabled if needed.
Federated Search for Cloud to On-Premises Deployments
Splunk 9 introduces a number of enhancements to Federated Search that you’ll want to leverage if you have Splunk Cloud + Splunk On-Premises environments. The short list includes:
- Transparent mode federated searches let you span your searches across a single On-Premises and multiple Splunk Cloud deployments.
- Ability to run scheduled searches and Workload management across both environments.
- Can now search both event and metrics indexes on a federated provider.
If you have a Splunk Cloud + On-Premise environment, you’ll definitely want to look into taking advantage of all these new features.
Features being deprecated or removed in Splunk 9.0
Splunk 9 introduced the deprecation or removal of several older features and functionality including support for Python 2 and HTML dashboards – you must rebuild any HTML dashboards using Dashboard Studio, and you should have already finished or planned upgrades of your Splunkbase and any custom Splunk apps to utilize Python 3.
If you have some older version Universal Forwarders (v5.x and lower) you might note that support for Splunk-To-Splunk (S2S) Protocol V3 (S2S is used to send data to Splunk indexers) and lower is deprecated, and Splunk will remove support for these versions in a future release of version 9.0. Splunk forwarders version 6.x and higher use the newer S2S V4 by default and will not be affected; if you have older forwarders in use now is the time to plan your upgrades.
You may want to peruse the entire list of deprecated and removed features in Splunk 9 so you can prepare alternatives or take advantage of newer features with more capabilities.
Benefits of Upgrading to Splunk 9.0
In addition to the ability to better control of your data and the possible savings from reduced ingestion volume gained from using ingest actions as well as all the other new features outlined above, there are additional reasons to consider upgrading to Splunk 9.
Security is ever important, and Splunk Enterprise 9 includes some security changes and enhancements that you can enable after you upgrade including the addition of Transport Layer Security (TLS) certificate host name validation. Hostname verification is a part of HTTPS that involves a server identity check to make sure the client is talking to the correct server and hasn’t been redirected by a ‘man in the middle’ attack. The check involves looking at the certificate sent by the server and verifying that the dnsName in the subjectAltName field of the certificate matches the host portion of the URL used to make the request.
In addition, the splunkd, all Python modules that Splunk uses, the Splunk CLI, and the App Key Value Store now support TLS certificate validation, and there have been some fixes for a critical vulnerability in deployment server client and server authentication.
See the Splunk docs for more information on Splunk 9 security updates.
Upgrade to Splunk 9.0 From an Earlier Version Considerations
For the most part, upgrading to Splunk 9 follows the typical upgrade process, adjusted as needed to accommodate the deployment and instance types:
- Verify that the Splunk instances are working correctly and back them up
- Install Splunk 9 over the existing installation per the OS-type instructions
- Confirm everything works after the upgrade
However, there are additional actions to take if your current version of Splunk Enterprise is below 8.1.x – you will have to upgrade to 8.1 before upgrading further to Splunk 9.0 – check the installation manual section on upgrading Splunk for details.
Conclusion
In this article we covered some of the most intriguing enhancements and additions provided in Splunk Enterprise 9.0 including ingest actions, redundant cluster manager capability, improvements to Dashboard Studio capabilities, and a number of features that improve security and reliability. You should probably plan for an upgrade soon – let us know if we can help!
If you found this helpful…
You don’t have to master Splunk by yourself in order to get the most value out of it. Small, day-to-day optimizations of your environment can make all the difference in how you understand and use the data in your Splunk environment to manage all the work on your plate.
Cue Atlas Assessment: Instantly see where your Splunk environment is excelling and opportunities for improvement. From download to results, the whole process takes less than 30 minutes. Start by clicking the button below:


