

In today’s complex IT landscapes, security and IT teams face significant challenges in understanding and communicating their security posture. Diverse environments, including hybrid clouds and containerized setups, often obscure risks and complicate compliance efforts. This lack of clarity can delay threat detection and response, increasing vulnerability.
Practical visualization methods offer a solution. They transform raw data into insightful dashboards without compromising security hygiene. By integrating these approaches with secure Splunk architectures, teams can enhance transparency, strengthen defenses, and maintain compliance. This blog explores reliable strategies to achieve this balance, focusing on Splunk’s capabilities in containerized environments.
The Role of Visualization in Threat Awareness
Effective visualization plays a crucial role in elevating threat awareness. It enables teams to detect gaps in security coverage quickly and respond with precision. For instance, dashboards that highlight anomalies in real time reduce the time spent sifting through logs.
Turning raw data into actionable insights brings several benefits. Teams gain a holistic view of risks, from misconfigurations to emerging threats. This clarity fosters proactive decision-making, such as prioritizing remediation efforts. In Splunk, visualization tools like custom panels and charts make complex datasets accessible, empowering SOC managers to act swiftly.
Secure Containers for Splunk
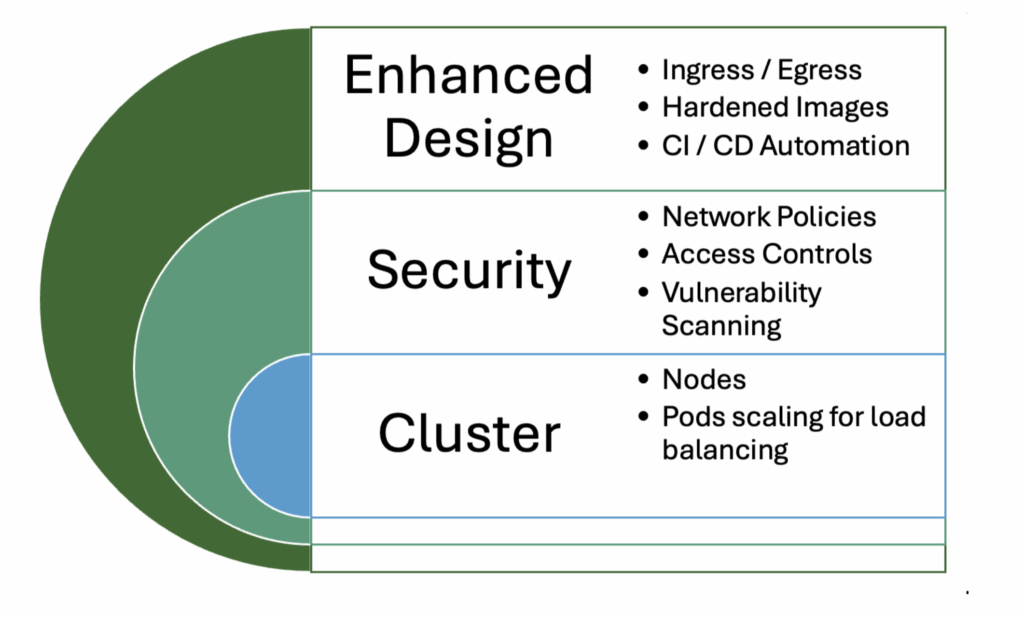
Secure containerization forms the foundation for scalable and controlled visualization in Splunk. Containers isolate workloads, ensuring that visualization processes do not expose sensitive data. This setup supports deployment across diverse environments while minimizing attack surfaces.
Container boundaries enhance security by enforcing strict access controls and resource limits. They allow flexible dashboard deployment without risking the underlying infrastructure. To set up secure Splunk containers effectively, start with Docker or Kubernetes. Use hardened images, enable runtime security tools, and implement network segmentation. Regular scanning for vulnerabilities and automated updates further bolster hygiene.
Building Effective Security Posture Visualizations
Creating impactful visualizations requires adherence to key principles. Focus on dashboards that reveal genuine risks without overwhelming users with noise. Prioritize simplicity, relevance, and interactivity to ensure usability.
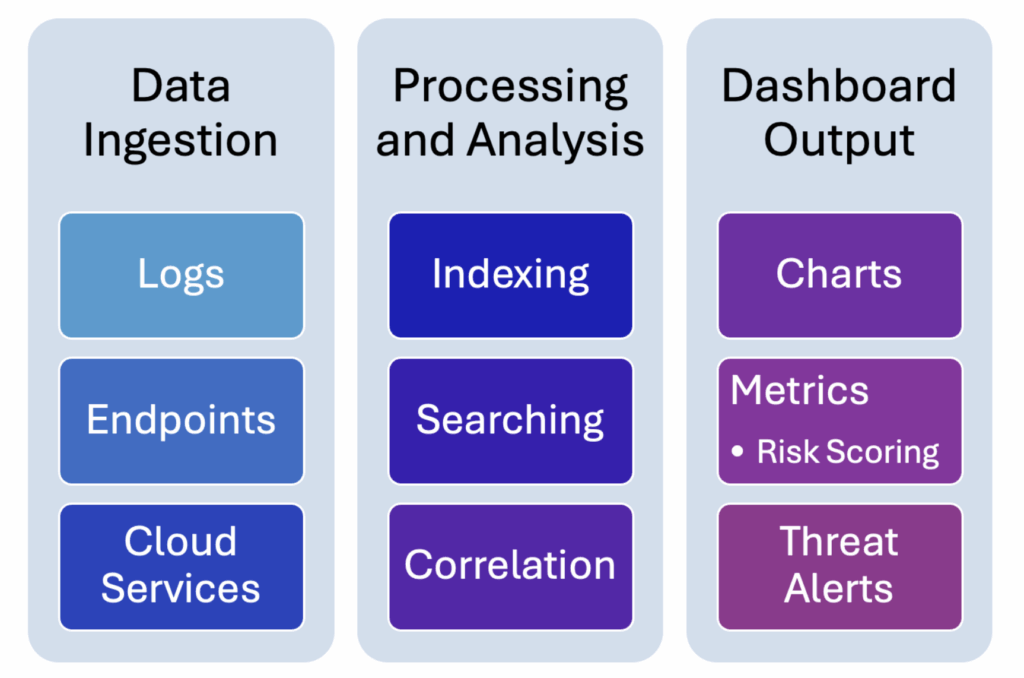
Map visual metrics to essential categories like coverage, compliance, and incident readiness. For coverage, track endpoint protection rates with heat maps. Compliance visuals might include pie charts showing policy adherence. Incident readiness can use line graphs to monitor response times.
Examples of KPIs include vulnerability counts, patch compliance percentages, and threat detection rates. Incorporate visuals such as bar charts for risk scoring and timelines for incident trends. In Splunk, leverage apps like Enterprise Security to build these elements, ensuring they integrate seamlessly with containerized setups.
Practical Steps for Implementation
Implementing these visualizations begins with auditing current data sources and dashboards. Identify gaps in coverage and redundant elements to streamline your setup.
Next, deploy secure container environments to isolate visualization workloads. Use tools like Kubernetes to orchestrate Splunk instances, applying pod security policies for protection.
Establish access controls through role-based permissions and implement versioning for dashboards. This ensures changes are tracked and reversible. Test integrations in staging environments before production rollout to maintain stability.
Hygiene & Threat Awareness in Action
Posture visualization directly reduces blind spots by providing real-time insights into hygiene issues. For example, dashboards can flag unpatched systems, allowing teams to address them promptly.
Secure containerization protects sensitive data during this process. It prevents unauthorized access while enabling clear views of threats. In practice, this combination improves response speed, as analysts can correlate events across isolated environments without exposure risks.
A financial organization case study demonstrates these benefits. Facing hybrid environment challenges, they adopted secure Splunk containers for posture visualization. This led to a 30% reduction in misconfigurations and halved remediation cycles. Leadership gained clearer risk reports, enhancing strategic decisions.
Business Impact & ROI
The business impact of improved visualization is profound. Clearer risk communication to leadership and stakeholders builds trust and supports informed investments.
Teams experience reduced time to detect and remediate gaps, lowering overall exposure. Proactive identification of weak points prevents costly breaches.
ROI manifests in efficiency gains and risk mitigation. For instance, faster threat responses can save thousands in potential downtime costs. By quantifying these improvements, organizations justify further enhancements in security infrastructure.
Next Steps for Security & IT Teams
To advance, review your current visualization approach and container strategy. Assess alignment with best practices outlined here.
Plan a transition to secure containerized dashboards, starting with pilot projects. Allocate resources for integration and testing.
Train analysts and engineers on interpreting posture visuals. Focus on actionable responses to ensure maximum value from these tools.
By following these steps, teams can achieve stronger threat awareness and maintain robust security hygiene in Splunk environments.


