

Are you curious about using file and directory monitors to notice new data in log files and ingest those into Splunk? You’re in luck.
In this post, we’ll use the monitor stanza in inputs.conf to set the instructions to onboard data into Splunk Enterprise or Splunk Cloud. We’ll also look at using the web interface for onboarding data and briefly discuss forwarder management. We’ll go through the standard options and discuss when to use which options.
Let’s get started.
How Splunk Monitor works
Monitoring files is more than only reading and sending the contents to Splunk. We want monitor statements only to send each event in the log file once. What we can’t have is duplicate data.
When a monitor input looks at a file, it starts by reading the first 256 bytes (by default – this is adjustable) of the file and performing a hash on that data. Then Splunk checks a specialty index called the fishbucket (See our blog post about the fishbucket) to determine if we already monitor that file.
For new files, we ingest the content and add a hash for the file to the fishbucket.
For already monitored files, Splunk goes to the pointer record stored in fishbucket and determines if there is new data from there. If yes, Splunk ingests the latest data and updates the pointer record is updated.
If the monitor statement is upon a directory, then Splunk monitors each file, including any files created after the monitor statement’s enactment.
How to Create Monitor Statements via Editing a Config Directly
To create a file or directory, monitor takes the correct stanza and options in inputs.conf. Whether you choose to directly edit inputs, make the input via a web interface, use REST calls to create the input, or use the CLI commands, the result is that inputs.conf is updated.
Only editing the conf file grants access to all the possibilities. Speaking of options, the spec file for inputs.conf has 3,836 lines on a 9.0 server. We’ll go through a few of the most common ones here, along with the format.
All monitor statements start with the following stanza (stanza being recognizable with the square brackets):
[monitor://<filename or directory name>]
Example 1: [monitor:///opt/logs/results.log]
Example 2: [monitor://C:\Program Files\LoggerTool\dailyerrors.log]

Example 3: [monitor:///var/log/]

Example 4: [monitor://C:\Data\]
Examples one and two monitor individual files. Examples 3 and 4 monitors all the files in the directory.
Note: On *nix boxes, we will have three forward slashes. The first two belong to the stanza; the next is for creating absolute directory paths.
Once the monitor stanza is ready, we can add various keywords to override behaviors. The first set of parameters that you’ll want to set, if possible, is the metadata: index, host, source, sourcetype
Example stanza:
[monitor:///opt/logs/results.log]

index = test

host = webserver1

sourcetype = FunkyWebServerLog
We recommend two additional settings when sending from a UF: EVENT_BREAKER and _EVENT_BREAKER_ENABLE. The event breaker is a regular expression and is useful when sending data.
Example stanza:
[monitor:///opt/logs/results.log]

index = test

host = webserver1

sourcetype = FunkyWebServerLog
EVENT_BREAKER_ENABLE = true

EVENT_BREAKER = ([\r\n]+)\d{2}-\w{3}-\d{4}
File or Directory:
Monitors against files should have all the metadata applied to the command. When placing a monitor on a directory, you can use the sourcetype metadata if each file is the same. However, when the logs are different, sourcetype cannot be applied in the monitor statement because monitor statements support only one sourcetype per stanza. Handling different sourcetypes requires using props.conf.
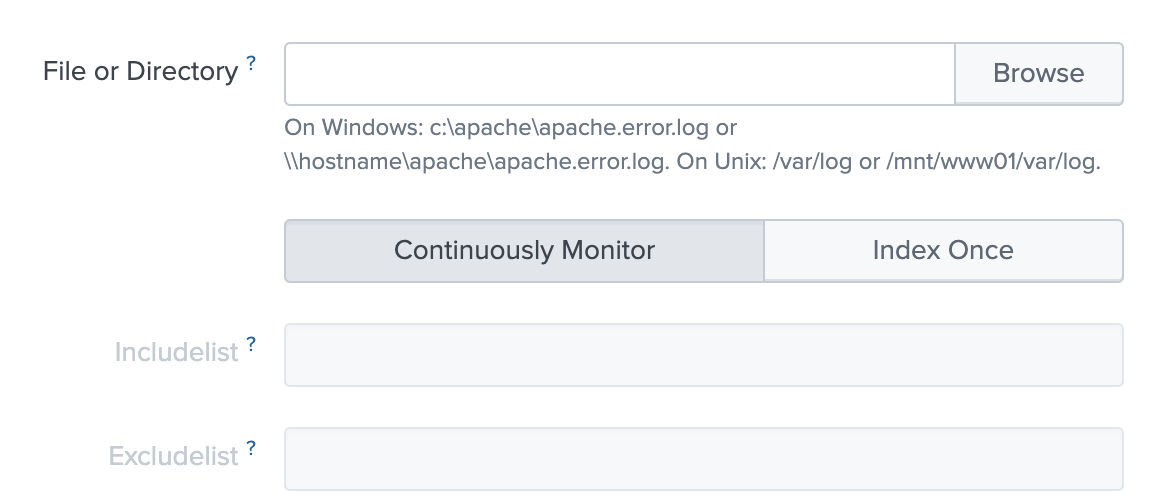
Includelist and excludelists:
Note: These terms are new for Splunk 9 and replaced biased language. Older systems will have different ___list commands.
When monitoring directories, you may use include and exclude lists to select only the files in the directory you wish to monitor.
Excludelists is a regex that removes data from the monitor that otherwise is included.
Includelists are a regex used to filter what data is collected.
If you have both exclude and include lists, then includes create a list of files accepted into the statement, and then the exclude statement disqualifies the files from that set of files to monitor.
Wild Cards:
Monitor statements support the use of wildcards. We’ll look at two wildcards that feature a subtle difference. The first wildcard is *, which allows any number of characters but does not extend past directory levels. The second wildcard is …, which also allows any number of characters but does not respect directory levels.
Let’s look at an example to understand the difference:
/data/weblogs/www1/access.log

/data/weblogs/www2/access.log

/data/weblogs/www1/debug/access.log

/data/weblogs/www2/debug/access.log
[monitor:///data/weblogs/*/access.log] would find only the two entries as * doesn’t extend past directory levels.
[monitor:///data/weblogs/…/access.log] finds all four entries as … extends past directory levels.
File Monitor from the web interface
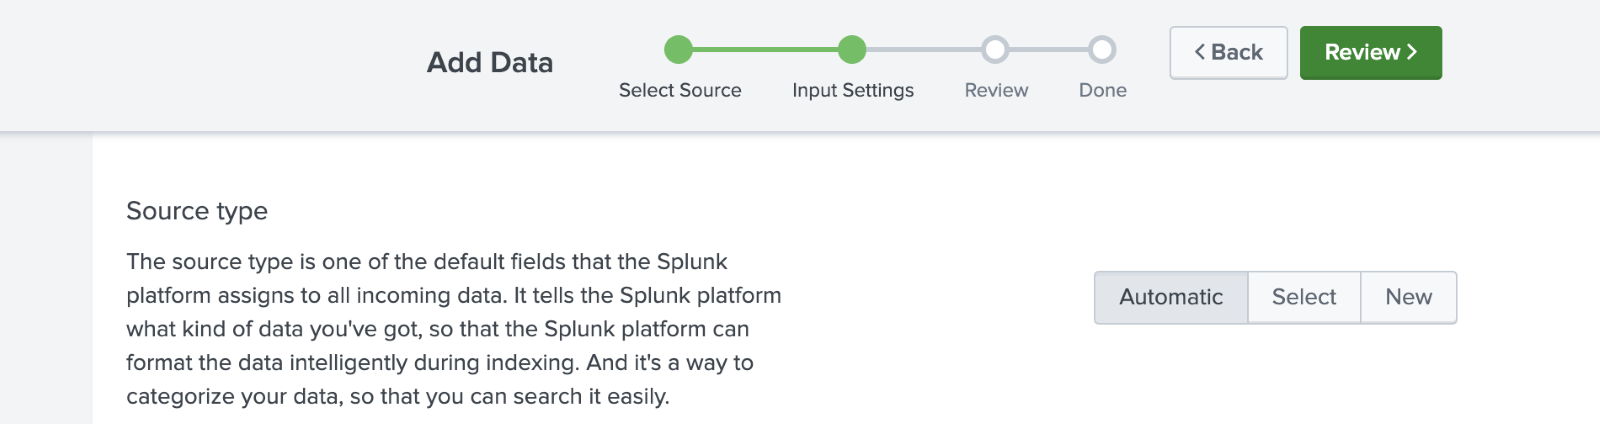
To create monitors from the web interface, click settings, then click the big “Add Data” button. Then select monitor, and finally, Files & Directories. A wizard will open, asking you to list the file or directory to monitor, along with a selection button to continuously monitor or index once. The continuous monitor selection is what this blog is about – watching a file or directory. The other option doesn’t create a monitor statement and instead performs a one-shot to get the data into Splunk but does not keep checking the data.
Creating configs with the web interface is most helpful in making the conf files on your test server (you have a test server, right?) that you can then move to your forwarders. The vast majority of Splunk systems lack web interfaces (e.g., Universal Forwarders).
Screen 1 of adding data: Select file or directory
Choose the file or directory to monitor. Either browse or type in a path.
Screen 2 of adding data: Set Source Type – only available when making a file monitor
When performing a file monitor, the data preview comes up, allowing testing of sourcetypes. When making directory monitors, this is unavailable.
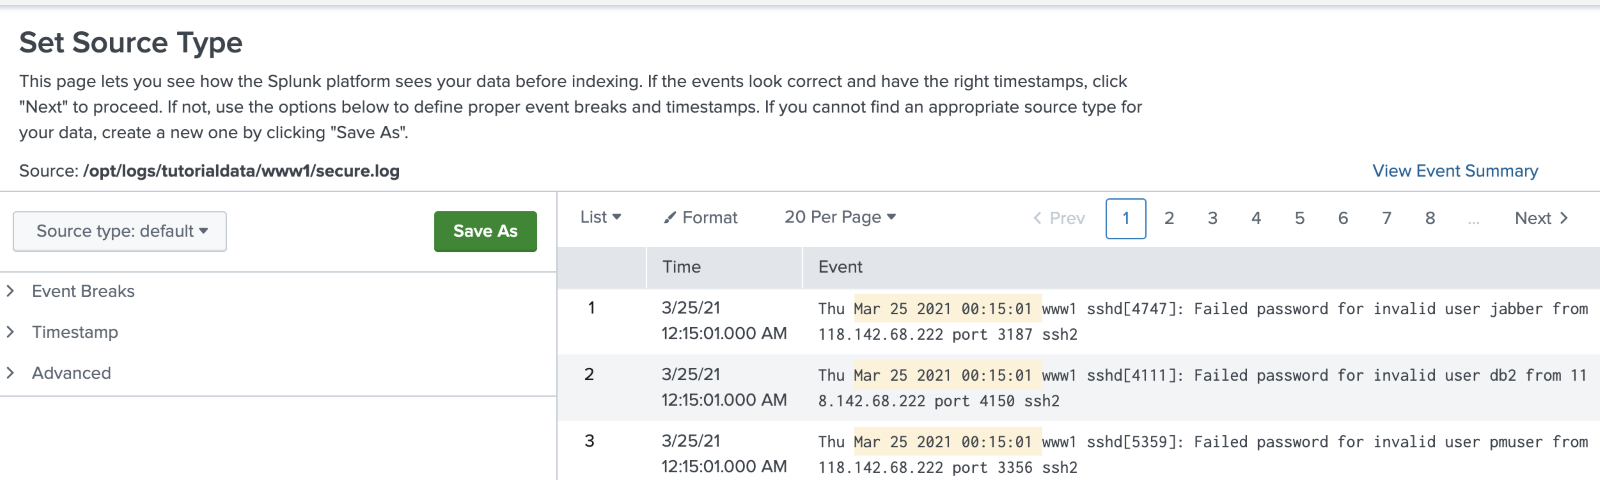
Trick: If your directory is all the same sourcetype, then build the sourcetype with a file monitor, save the sourcetype, then cancel before ingesting data. Then edit the conf file to set the sourcetype.
Screen 3 of adding data: Input settings – File Monitor
Choose the App Context (where the inputs.conf is written), Host Field, and Index.
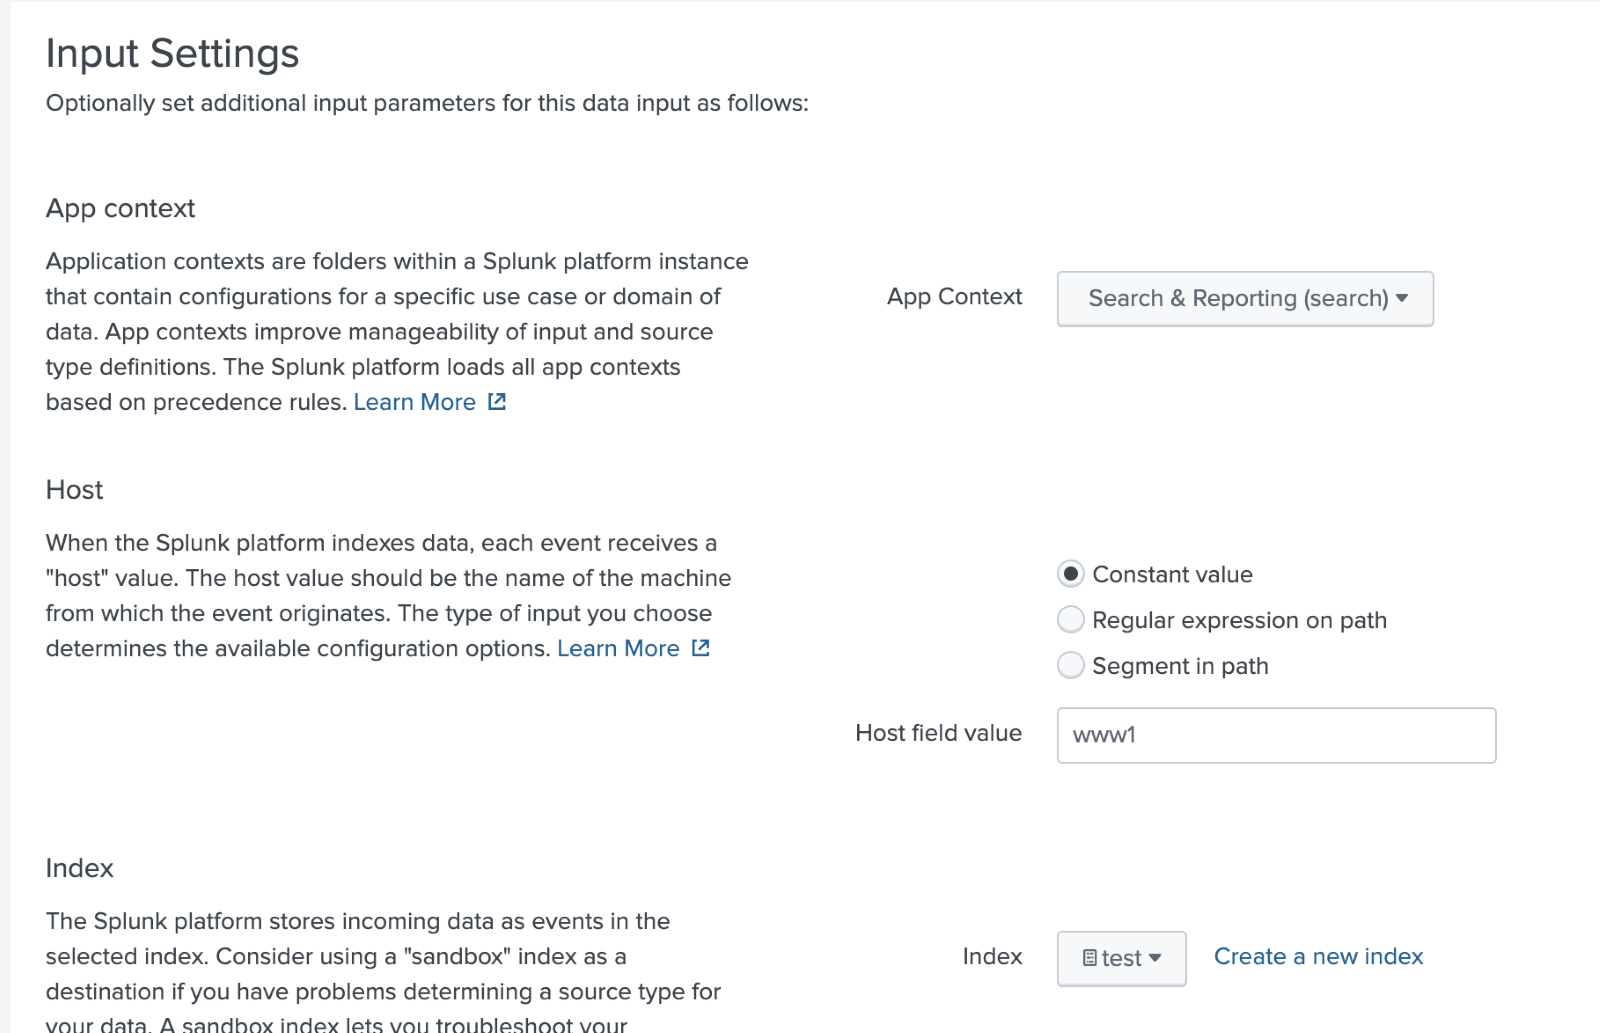
Screen 3 of adding data: Input settings – Directory Monitor
If performing a directory monitor, the choice of sourcetypes will be on this page. For monitors that cover the same sourcetype, select it or create a new one. For monitors that are not the same, use automatic sourcetyping, then consider using props.conf to more accurately set the sourcetype.
Monitor statements with the CLI:
Don’t bother.
Learn to create configs without logging on to individual servers. They may be tempting to use on test servers, but you also have the web interface in test environments. No one should be logging on to thousands of forwarders and running CLI commands.
Monitor Statements with Forwarder Management:
Forwarder Management, aka the Deployment server, is a great way to push configurations to many forwarders. My preferred method is to create a custom app and place custom inputs.conf in the app that contains all the metadata fields and event breaker settings. However, for those using Forwarder Management, it is a similar interface to using the web UI. The most significant difference is an initial screen to choose which server class (think, list of UFs based on heuristics) on which to place the configuration. Be sure to set the metadata as above if using the web UI.
The other type of monitor?
A second file and directory ingest mode exists, batch mode. But that is a tale for another post.
Conclusion
Splunk file and directory Monitors are how new entries in files and newly created files ingest into Splunk. The preferred method to perform monitor statements is via editing inputs.conf directly as that grants access to additional options to tune accuracy and performance. The web interface for Add Data is another option with fewer options, but it is fast to create monitors and is an excellent way to develop inputs.conf on your test servers.
If you found this helpful…
You don’t have to master Splunk by yourself in order to get the most value out of it. Small, day-to-day optimizations of your environment can make all the difference in how you understand and use the data in your Splunk environment to manage all the work on your plate.
Cue Atlas Assessment: Instantly see where your Splunk environment is excelling and opportunities for improvement. From download to results, the whole process takes less than 30 minutes using the button below:


