What is CloudWatch?
Amazon CloudWatch is a tool that provides monitoring and management services for system data from many of the AWS instances like Elastic Compute Cloud (Amazon EC2), AWS CloudTrail, Route 53, and Amazon RDS database. It provides capabilities to monitor log files, set alerts and react to changes in your AWS instances.
The cost of using Amazon CloudWatch can be substantial depending on the services you select to enable. Most of the cost is incurred when turning on metric group capabilities like Custom metrics, detailed monitoring, and metrics or API request and Metric Streams. However, AWS services, such as Elastic Compute Cloud (EC2), S3 and Kinesis Data Firehose, automatically send metrics to CloudWatch at no charge. If all you need is available from the basic monitoring feature Amazon CloudWatch then why not send these cloud logs to Splunk for monitoring and analysis.
The Benefit of Connecting CloudWatch to Splunk
Sending these logs to Splunk provides the ability to investigate unwanted security events from cloud instances, perform alerting on suspicious events, track log activity for compliance, perform alerting on health-related activities, and create visualize for pictorial views of Cloud environment.
How to Integrate CloudWatch with Splunk
If you were wondering, how do I get started with getting AWS CloudWatch logs into your Splunk environment, then here are a few things to consider:
For AWS will you need:
- A valid AWS account configured with the proper role and permissions to access logs from Amazon CloudWatch services.
- For Splunk will you need:
- Splunk Add-on for AWS
- Splunk Cloud Support (If plan to use a Splunk Cloud instance)
- Enough Storage for log ingestion.
- Enough available license for log ingestion.
The following diagram illustrates a solution architecture for getting CloudWatch logs into Splunk.
An AWS account is required to access logs from Amazon CloudWatch via an established connection between Amazon CloudWatch and Splunk. The Splunk administrator will configure a Splunk add-on with an AWS account access key and secret from an Amazon IAM (Identity and Access Management) user to establish the connection.
The Splunk server that pulls CloudWatch logs can be a Splunk Cloud instance, an on-premises stand-alone system, or a heavy forwarder. The Splunk Add-on for AWS is installed on the system and provides the GUI configuration menus for entering connection information, which in turn establishes connectivity to Amazon CloudWatch. The add-on also supports both push-based and pull-based data collection based on the type of logs, as depicted by the double arrows.
From your favorite browser, you will view CloudWatch logs via your Splunk Web console and use it to create all your Splunk knowledge objects like reports, alerts, and dashboards.
Detailed AWS Configuration
Getting CloudWatch logs into Splunk starts with configuring an AWS Identity Account Management (IAM) role and account in AWS. You must either have AWS administrator access or work with your AWS admin to set up the accounts with the required permissions. This link to the Splunk documentation for the AWS add-on can provide details on this configuration (Link). Additionally, this role will need to be configured with adequate permissions to cover all required inputs for your EC2 (and other) instances. See here for details (Link). For access to CloudWatch Log inputs the following permissions are required:
- DescribeLogGroups
- DescribeLogStreams
- GetLogEvents
- S3:GetBucketLocation
These settings are applied to the role via inline policy to configure input permissions:
{

  "Version": "2012-10-17",

  "Statement": [

{

   "Action": [

     "logs:DescribeLogGroups",

     "logs:DescribeLogStreams",

     "logs:GetLogEvents",

     "s3:GetBucketLocation"

   ],

   "Effect": "Allow",

   "Resource": "*"

}

  ]

}
This policy ensures that the role has the appropriate trust relationship with the flow log service.
{

  "Version": "2012-10-17",

  "Statement": [

{

   "Effect": "Allow",

   "Principal": {

     "Service": "vpc-flow-logs.amazonaws.com"

   },

   "Action": "sts:AssumeRole"

}

  ]

}
After configuring the role, assign it to the AWS accounts to be used for connectivity to Splunk.
Detailed Splunk Configuration
After you have completed the configuring for the IAM role and account, you want to focus on configuration in the Splunk environment. Download the Splunk Add-on for AWS from Splunkbase – see here. Install the Splunk Add-on for AWS onto your Splunk instance.
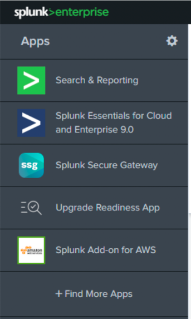
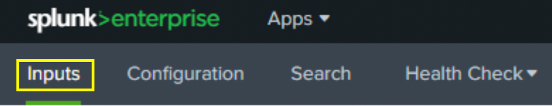
Step 1: Open the Splunk Web console and click on the Splunk Add-On for AWS tab.
Click on Configuration menu item in the app navigation bar.
Step 2: Click the Add button.
Step 3: Provide the name of the AWS account.
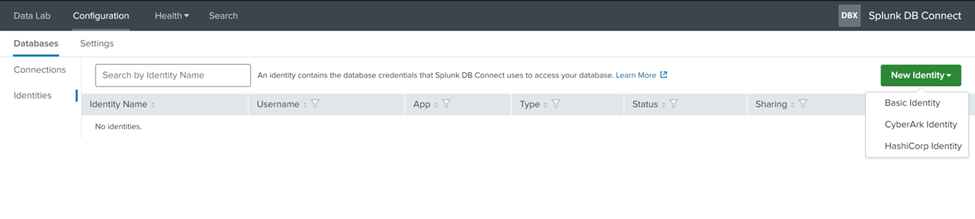
Step 4: Enter the Key ID and Secret Key credentials (…) from AWS account. Note, this account was previously configured with role and permissions necessary for data collection.
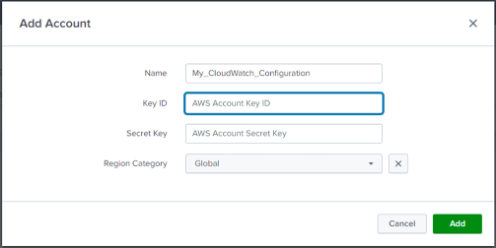
Step 5: Select the Region Category for the account. The most common category is Global.
Step 6: Click the Add button.
Now that the account has been created you will now use it for configuring the input for data collection.
Step 7: Click on the Input menu item in the app navigation bar.
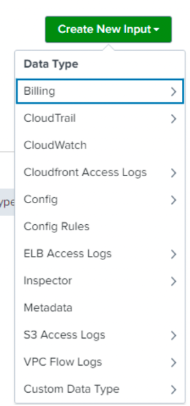
Step 8: Click on the Create New Input button and select CloudWatch from the drop-down menu.
Step 9: Fill out the form for Name, AWS Account, Assume Role, AWS Regions, Use Private Endpoints, Metrics Configuration, Source Type, Index and Advanced Settings (as required).
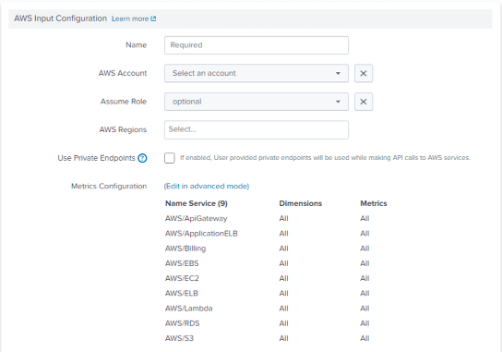
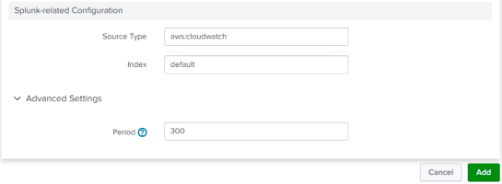
Step 10: Click Add to complete input configuration.
Validate log collection
Validate that you are retrieving events from CloudWatch by installing the Splunk App for AWS and review the included dashboards or use the Search and Reporting app to view events in the index previously configured. If you choose to install the app keep in mind that this app is currently at the end of life and made not be supported by Splunk.
Conclusion
In this post we provided a general overview of how to get CloudWatch logs into Splunk. The value received from accessing your CloudWatch log from Splunk can be enormous. You have the convenience of analyzing your EC2 and other instances for security, compliance, and other use cases. Also, you will be able to generate knowledge objects like reports, alerts, and dashboards as well as to monitor your Cloud environment in a flexible, secure, and cost-effective way.
If you found this helpful…
You don’t have to master Splunk by yourself in order to get the most value out of it. Small, day-to-day optimizations of your environment can make all the difference in how you understand and use the data in your Splunk environment to manage all the work on your plate.
Cue Atlas Assessment: Instantly see where your Splunk environment is excelling and opportunities for improvement. From download to results, the whole process takes less than 30 minutes using the button below: