
Every beautiful dashboard and impressive visual Splunk is capable of producing is, ultimately, driven by two things: data and search.
And while search is the primary driver behind the analytics and visualizations in Splunk, all the perfectly written and executed searches in the world can’t help you if you’re missing the most important resource of all — quality data.
If you’ve ever put together a Lego® set, you know you’ve got to have all the pieces if you’re going to be able to build the Lego Death Star. Even one missing piece could leave you frustrated and incapable of building what you set out to create.
In short: you have to know what data you’re working with, and that you have all of it.
Data Awareness Defined
“Data awareness” refers to your organization’s ability to look at the infrastructure bringing data into your Splunk environment, the visibility you have (or don’t have) when there’s a failure in your data pipeline, and the health of your forwarder infrastructure.
To get the most from Splunk, and to empower you to do more with the platform, there are two critical questions you must address:
Question 1: Do you have an alerting system in place when critical data streams fail in your Splunk environment?
Setting alerts for critical data streams is important for ensuring your dashboards and processes are up to best practices. You want to be the first person to know an issue has occurred so it can be solved before it becomes a larger problem.
Some may read that and think, “We check our data streams monthly or weekly, so we have a pretty good idea of how healthy our data pipeline is.” But what about those moments when a data stream or forwarder goes offline in between those manual checks?
Maybe it’s not important data… but maybe it is.
If you’re using Splunk for compliance, even a few moments of downtime can cause huge problems down the road. If you’re using Splunk for security, you know all too well how much meaningful (and dangerous) activity can occur within even a few minutes.
Alerts are best practice for a reason. Your team and those throughout the organization who rely on Splunk dashboards and visualizations for day-to-day operations, security, insights, and decision-making have to be able to trust the data. If your alerting isn’t strong, that means you could be missing data. And bad data is worse than no data at all.
Question 2: If you’re using Splunk Enterprise Security (ES), are you confident you’re ingesting all the appropriate data to get the most from your investment?
Splunk ES is an incredible tool, but depends on being fed the proper data for it to really shine. Without the ability to ensure you have full coverage for your priority data and clear eyes on that data’s acceleration, you could be leaving yourself vulnerable. The continuous security monitoring, advanced threat detection, and your ability to rapidly investigate and respond to threats is all contingent on priority data being fed into the system.
At a minimum, without that information, you’re certainly not maximizing your use of ES (or the dollars you’ve invested in the platform).
Solving Alerts
It’s possible that you can manually create alerts for any number of situations and needs within Splunk. Once again, that’s the power of having such a versatile platform at your fingertips. The downside to that approach, however, is that it’s time consuming and requires, many time, a degree of technical proficiency with Splunk that many internal teams lack.
What would be ideal is a single pane of glass that shows a complete inventory of every sourcetype in your Splunk deployment. Even better would be if that inventory could also show how much data is being received by that sourcetype, its status, a use case or description, admin notes, who owns it… you get the idea. And the cherry on top of this magical solution would be a push-button simple way to create an alert for that sourcetype.
This is exactly what the Data Management application within the Atlas Platform provides.
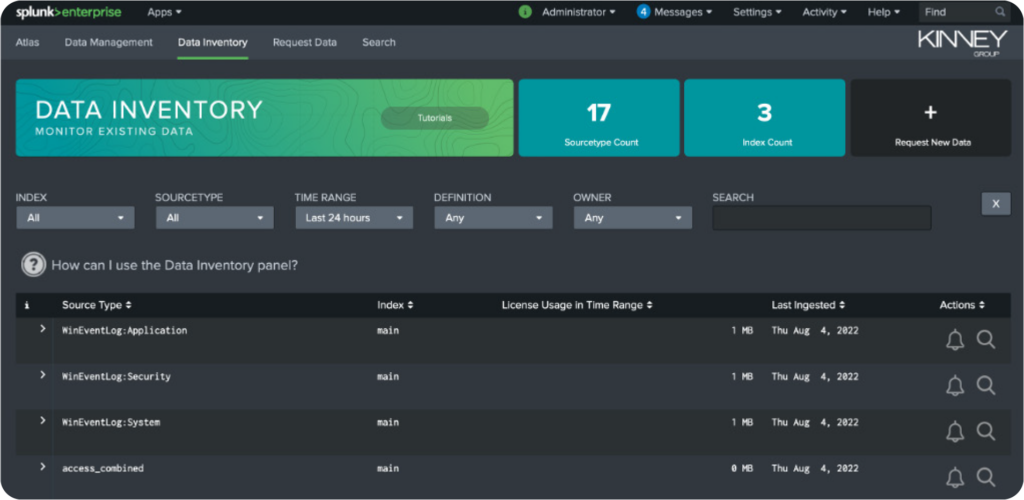
The Data Inventory component of Data Management allows you to easily see every sourcetype, the last time it was ingested, how much of your license that data is utilizing, and a host of other important information.
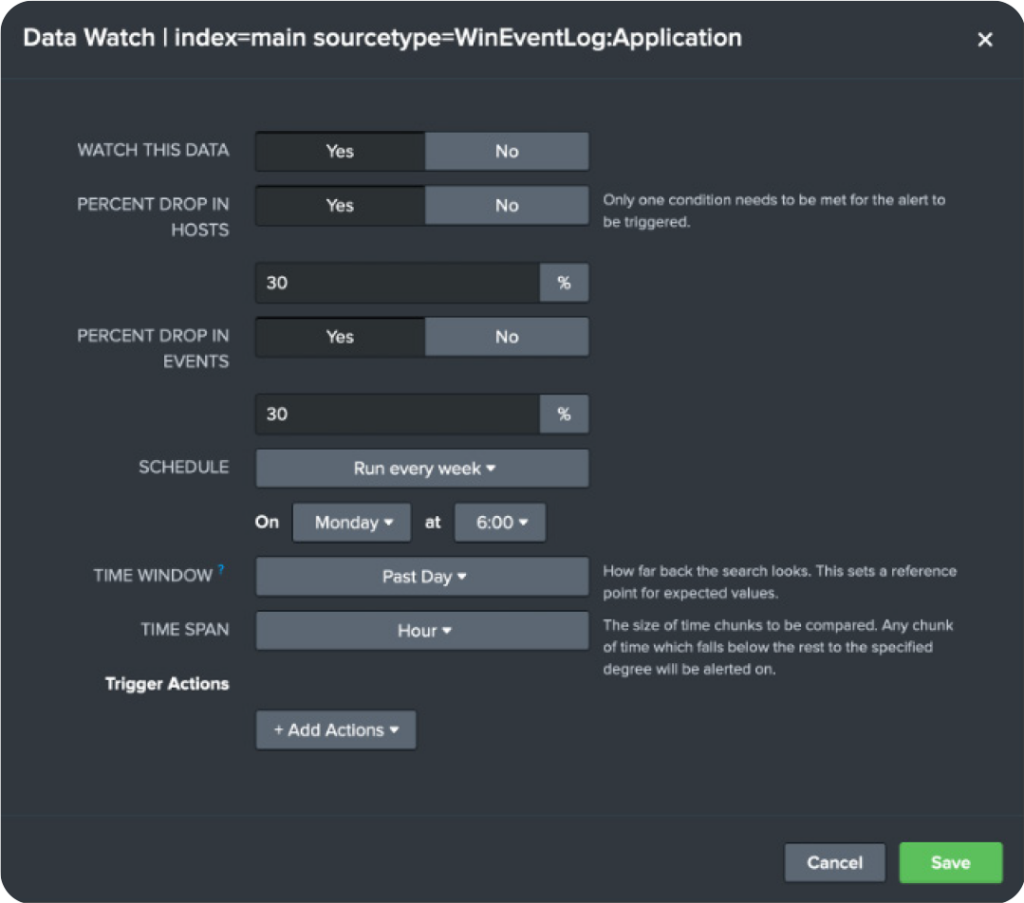
Utilizing the Data Watch feature by clicking on the alert icon inline with this information, you can also utilize Splunk to keep a watchful eye on the sourcetype and alert you when there’s a certain percentage drop in hosts or events:
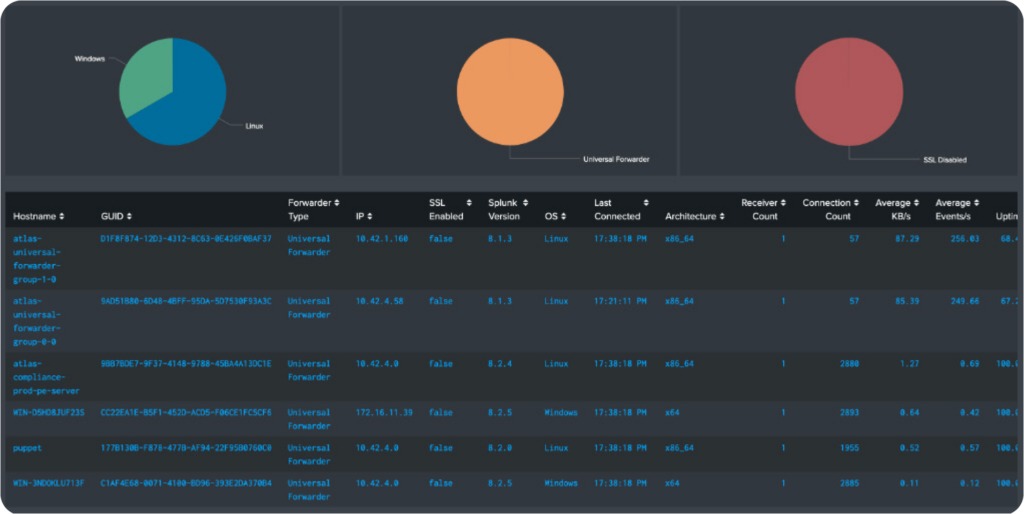
Of course, watching sourcetypes is only a piece of the puzzle. You also need a way to provide that same level of protection and visibility to your forwarders. This is where the Atlas Forwarder Awareness application swoops in to save the day with a system-wide overview of forwarder status that you can group however you wish, with the ability to dive into each group for details.
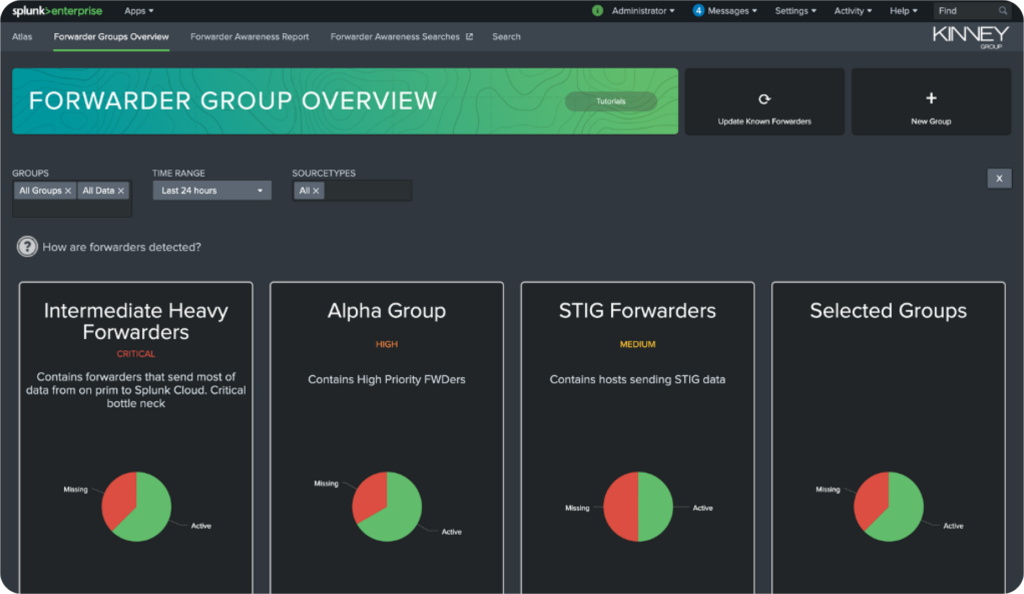
Within each group, you’ll have visibility into missing forwarders, the SSL status of each forwarder, the version of Splunk each forwarder is running, and a variety of other information that allows you peace of mind that data is reliable and being brought in to your environment properly.
Solving Enterprise Security
As stated, Enterprise Security depends on the right data — and especially priority data with clear eyes on acceleration of that data.
That’s why we’ve developed the Atlas ES Helper application to guide the process and ensure you have the coverage you need and you’re utilizing the platform effectively.
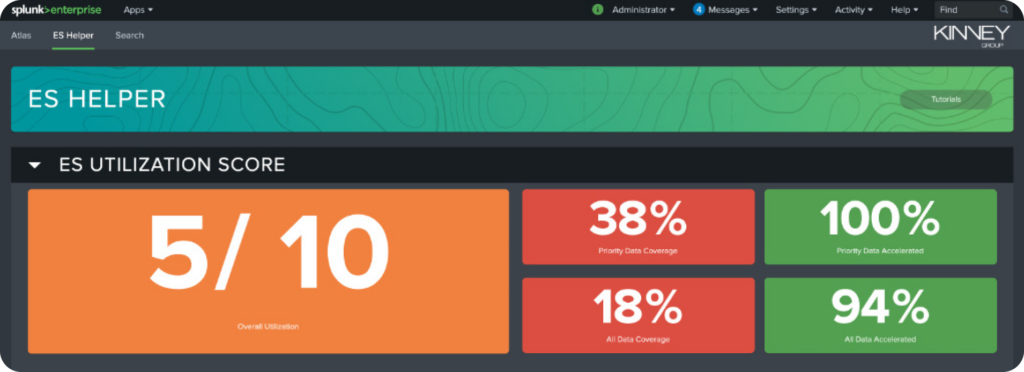
In addition to a comprehensive inventory of ES-related data models, the power of ES Helper is its ability to give you an understanding of your environment’s overall utilization, data coverage, and acceleration at a glance.
The proprietary ES Utilization score is based on scoring your system’s Priority Data Coverage, Priority Data Acceleration, Lower Data Coverage, and Lower Data Acceleration. The takeaway is an easy to understand and actionable report that tells you, with certainty, if you’re getting the most and doing the most with your investment in Splunk Enterprise Security.
Wrapping Up
Whether it’s a comprehensive understanding of your sourcetypes, data models, and forwarders or getting more from Splunk ES, the value of Data Awareness can’t be overstated. Downloading the free Atlas Assessment application from Splunkbase is the perfect way to see if Atlas is the right fit to solve these challenges in your environment.


