Getting Started with Splunk Observability & Kubernetes
Splunk Observability is purpose–built for capturing infrastructure metrics and traces, enabling developers to triage poor performance like never before, but working with it is different than Splunk Cloud or Splunk Enterprise. To showcase the difference, we will walk through how to get Kubernetes data into your Splunk Observability platform.
With Kubernetes data reporting in Splunk Observability, you will be able to visualize and identify slowdowns in operations and identify pain points in your deployments.
Getting Data In
Unlike Splunk Core or Splunk Enterprise Security, you don’t need to manage Splunk Forwarders to get data into Splunk Observability. You just need to understand the Data Management wizard! We will focus on using it to get Kubernetes data into our platform.
Data Management Integrations Wizard
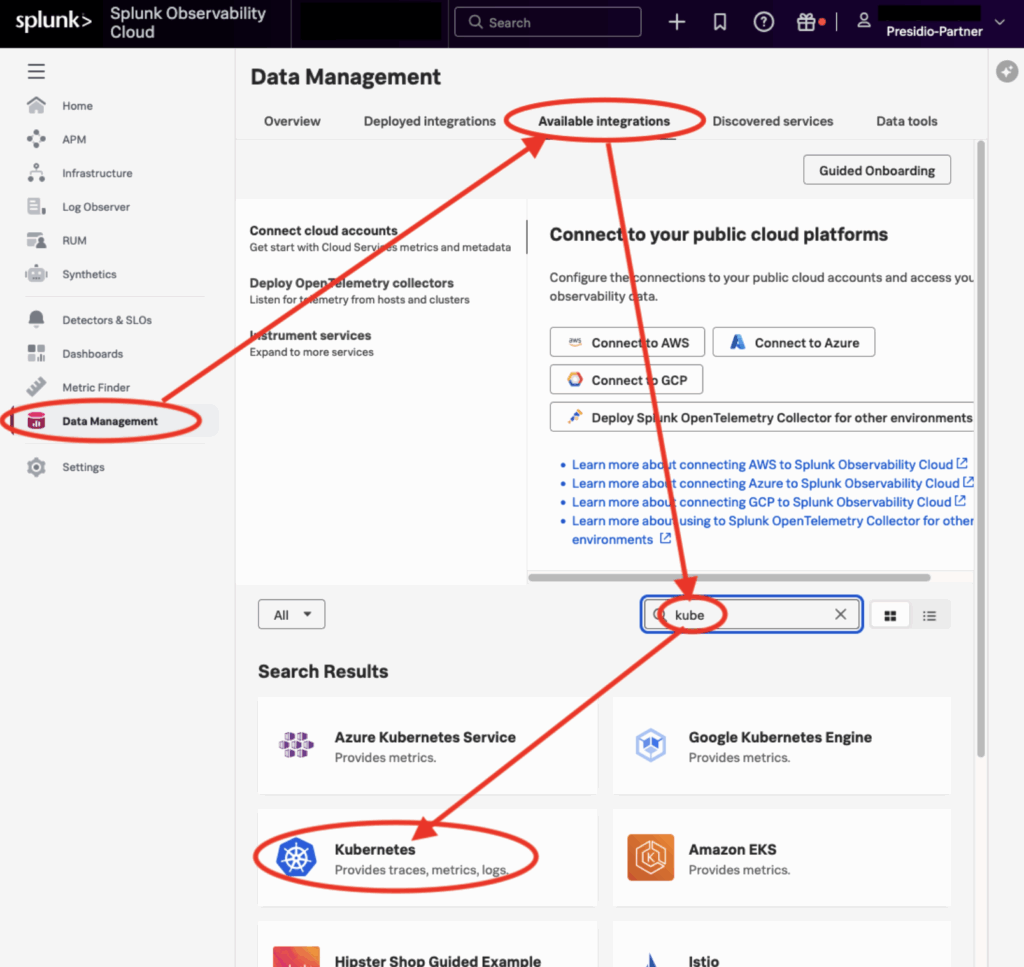
Go to the “Data Management” item in the sidebar and click on “Available Integrations” in the top nav. Type “kube”rnetes to filter down the search result list so you don’t have to scroll & hunt. Finally, click on the desired integration, Kubernetes.
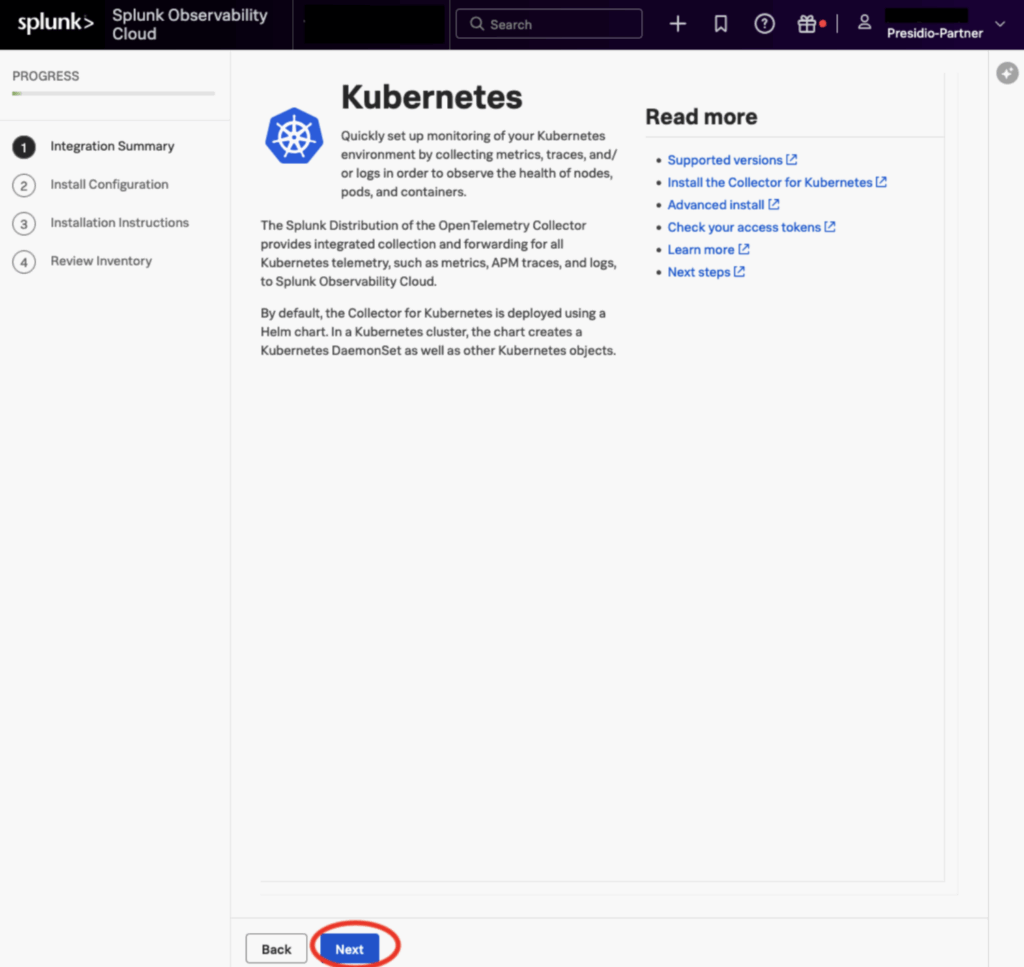
For some integrations, the first page may have commands or configuration items, but Kubernetes just has a splash screen with links to more documentation and help. Just press “next”
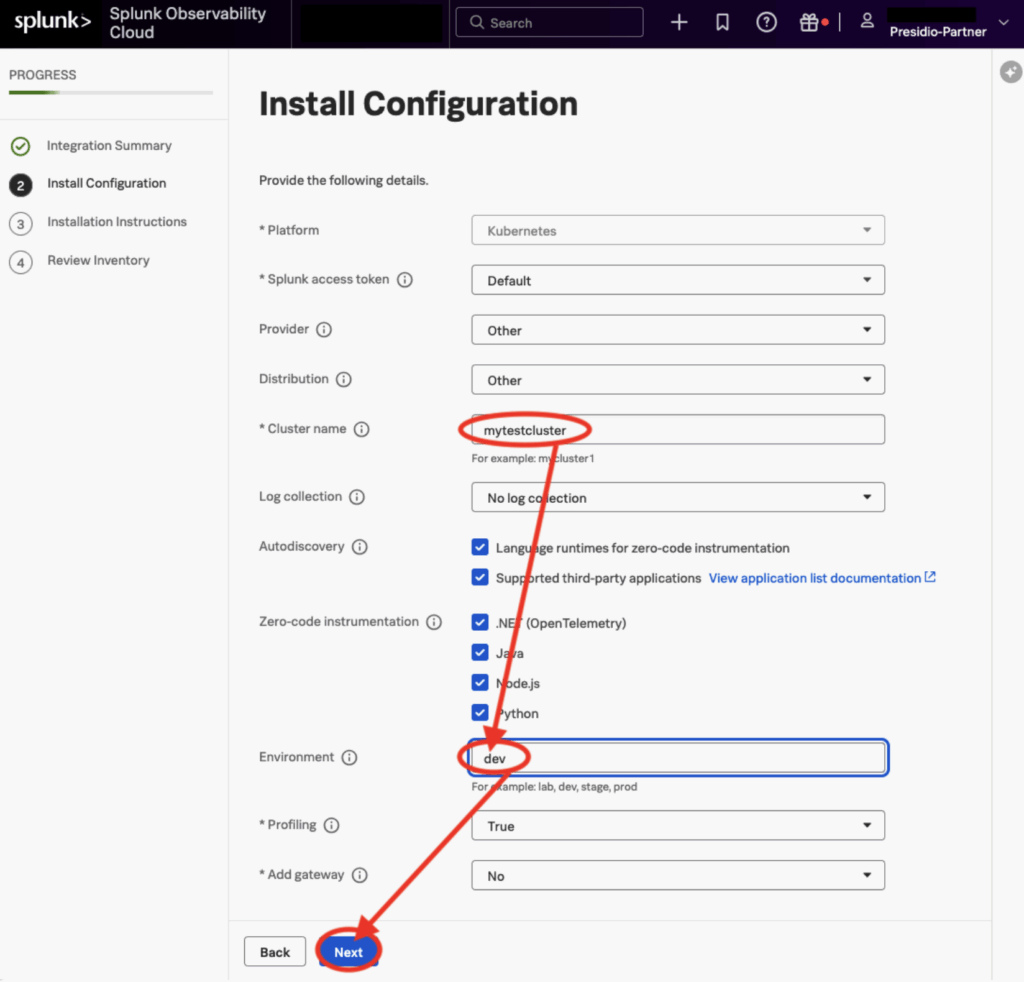
The second page has several Required configuration items, marked with “*”
Cluster Name must be filled in, and though “Environment” is not technically required, it’s still a good idea to supply an answer.
The guided setup assumes that you have Kubernetes installed, an application deployed, and Helm all set up. If Helm is not installed yet, you can install it (depending on your Linux distribution] like this:
sudo snap install helm --classic
NOTE: Further Helm install instructions here: https://helm.sh/docs/intro/install/
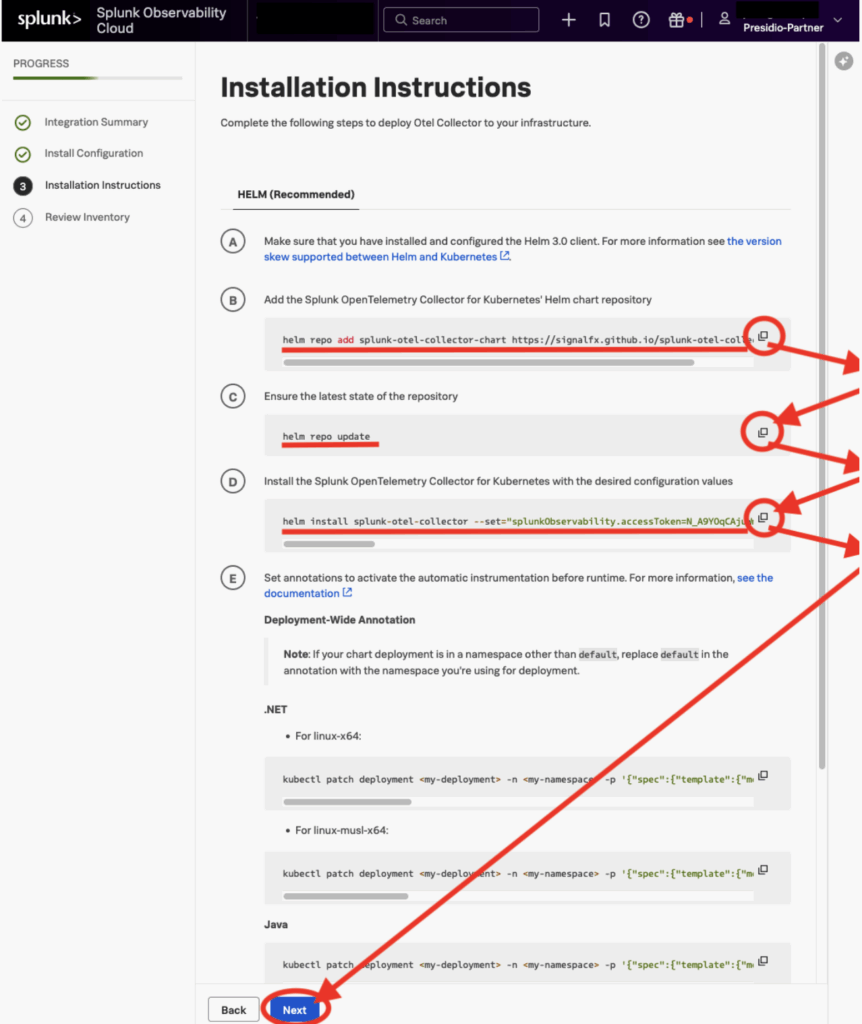
Next are a series of commands for you to execute in your cluster; copy each command line and paste it into your terminal, then click “next”. These commands will install the lightweight Observability agent, the ‘OpenTelemetry Collector’. You can think of these agents as preprogrammed forwarders that will send already formatted data to the Splunk Observability platform.
If you want to go deep on configuring all the little bits and pieces of the OTel agent, you can retrieve the helm “values.yaml” using helm, edit what you want, and run the helm command again, changing “install” to “upgrade”, and specifying values.yaml file with your changes. Modifying the yaml also lets you set up receivers, processors, exporters, and pipelines, providing endless configurability options.
					helm get values --all splunk-otel-collector -o yaml > values.yaml
vi values.yaml
helm upgrade splunk-otel-collector --set="splunkObservability.accessToken=UseYourTokenNotMine,clusterName=mytestcluster,splunkObservability.realm=us1,gateway.enabled=false,splunkObservability.profilingEnabled=true,environment=dev,operatorcrds.install=true,operator.enabled=true,agent.discovery.enabled=true" splunk-otel-collector-chart/splunk-otel-collector -f values.yaml
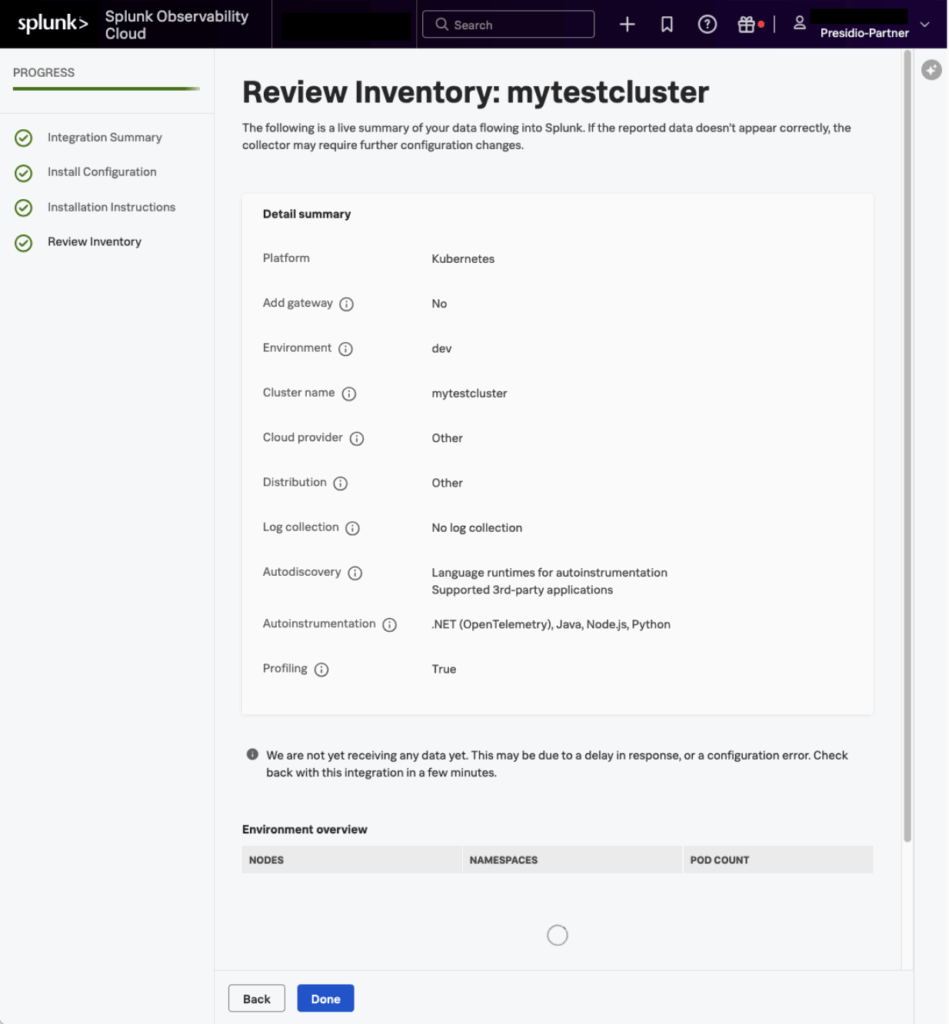
Next, you can validate that your configuration is correct and that data is coming in.
Now that you are Getting Data In, you can go on to creating new custom Dashboards and Charts, or using the Built-In Dashboards that come with Splunk Observability Cloud.
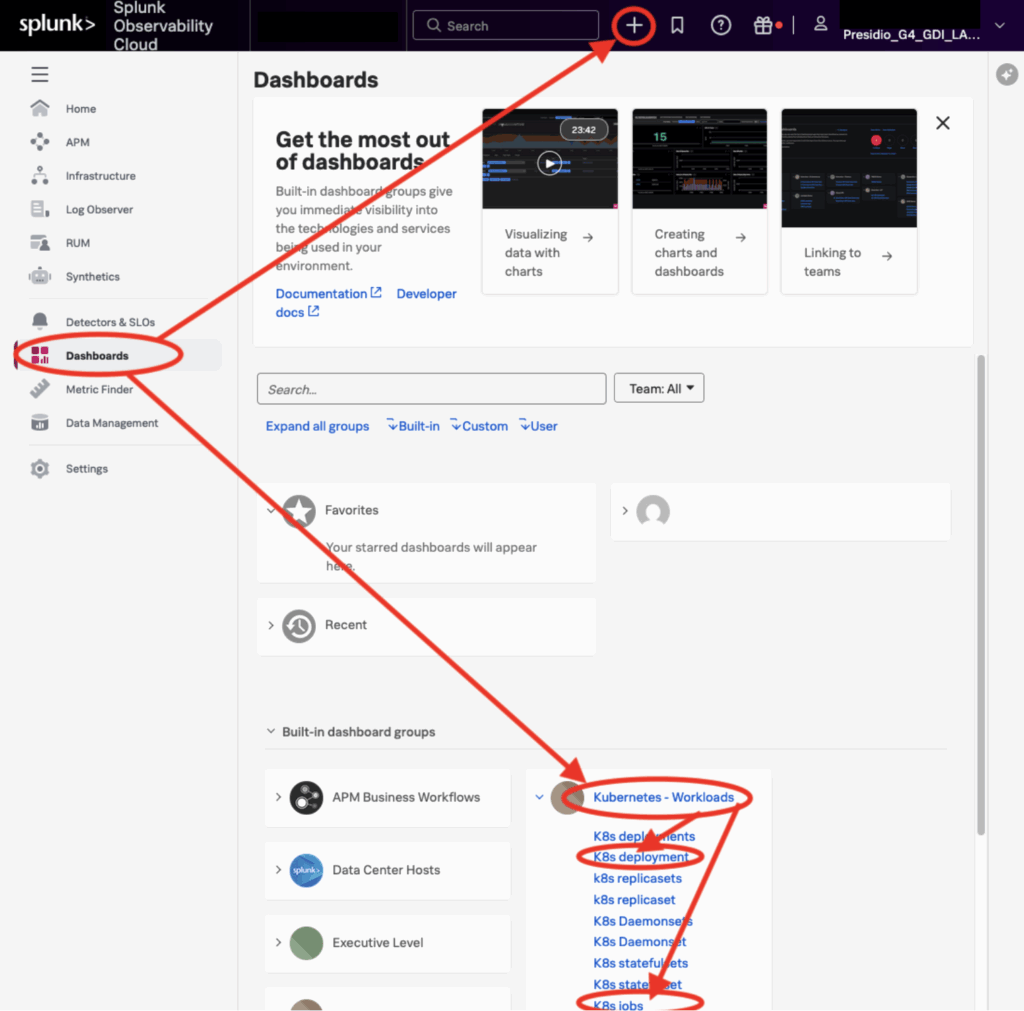
Having your Kubernetes data in Splunk Observability, powered by the Observability Agents, will provide a much further starting point for analyzing your workloads than compared to just getting your data into Splunk Enterprise. Just like Splunk Enterprise, power users and admins can further expand the reporting capabilities, enabling your technical teams to have unparalleled visibility into their containers!
If you need assistance with Splunk Observability, Presidio Splunk Practice is here to help! Happy Splunking!