So, you’re new to Splunk. You have your data ingested up and running and you’re familiar with Splunk’s Search Processing Language (SPL for short). But now you’re wondering how to go from the massive sandbox that is the Splunk platform, to a tailored experience that gets you custom dashboards and reports.
We’ve got you covered with a complete beginner’s guide to reports and dashboards. With these staple Splunk tools, you’ll be able to turn data into intelligence and intelligence into action!
Let’s get started with the basics.
How to Create a Report in Splunk
Scenario: A client wants to find the total number of successful purchases on their online store. They want to see how individual categories and products are selling.
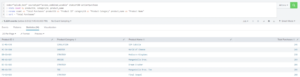
Step 1: Start your search in the search and reporting app.
In this example, we’re opting to rename the counts so that “Total Purchases” is at the top of our results.
index=”splunk_test” sourcetype=”access_combined_wcookie” status=200 action=purchase
|stats count by productId, categoryId product_name
|rename count as “Total Purchases” productId as “Product ID” category Id as “Product Category” product_name as “Product Name”
|sort – “Total Purchases”
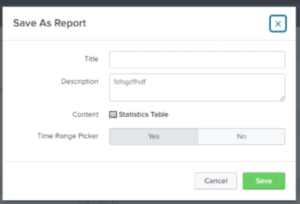
Step 2: Save your report.
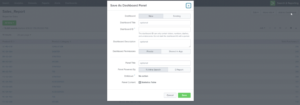
Select “Save As” then select “Report”.
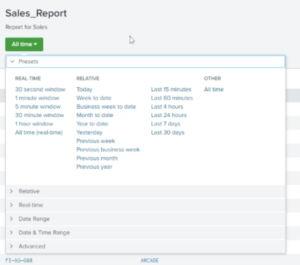
Include your title, description, content type, and whether you’d like to include a time range picker.
Select “Save”.
From here, you can “View” your dashboard and run it during your desired time period.
How To Add a Splunk Report to a Dashboard
A dashboard is a collection of searches that you can view all at once. You can use dashboards to get greater insight into your data. For example, if you want a dashboard of all your sales reports, you can create that by adding each report visualization to a dashboard.
Method 1: Use the “Add to Dashboard” Button on the reports page.
Method 2: Use the “Save as New/Existing Dashboard” option on the search page.
No matter which method you choose to create your dashboard, the following steps will be the same.
Step 1: Configure your dashboard.
Add your dashboard title, dashboard ID, description, and permissions. Then choose whether you want to use classic or dashboard studio to build your dashboard. Finally, select your panel title, and visualization type, then save your dashboard.
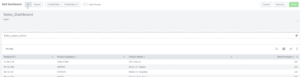
Step 2: Edit your dashboard.
You can choose from a number of options like editing the UI and source code of your dashboard or adding panels and inputs. Change the theme from light to dark if that’s your preferred style, and your dashboard is ready.
Splunk Reports and Dashboards Best Practices
1. Practice Makes Perfect
Your dashboard is extremely malleable, so take your time crafting it. You can start with simple visualizations for the time being and optimize them later using the “open search” button or “change visualization” button.
2. Save Often
This simple, yet often overlooked step can save you a lot of headaches down the road. If you leave the dashboard mid-edit, your work won’t be saved, so be sure to hit the save button before you go.
If you found this helpful…
You don’t have to master Splunk by yourself in order to get the most value out of it. Small, day-to-day optimizations of your environment can make all the difference in how you understand and use the data in your Splunk environment to manage all the work on your plate.
Cue Atlas Assessment 30-day free trial: a customized report to show you where your Splunk environment is excelling and opportunities for improvement. You’ll get your report in just 30 minutes.