

Here’s the situation: You’re a security analyst that’s been tasked with finding different attacks on your servers. You need to find various events relating to possible brute force attempts, suspicious web page visits, or even suspicious downloads.
This probably isn’t much of a hypothetical — it might be a reality for a lot of people. We get it. Security is incredibly important in the era of technology. Fortunately, Splunk makes it easy to find this information, by using the STATS search command.
What is the STATS command in Splunk?
STATS is a Splunk search command that calculates statistics. Those statistical calculations include count, average, minimum, maximum, standard deviation, etc. By using the STATS search command, you can find a high-level calculation of what’s happening to our machines.
The STATS command is made up of two parts: aggregation and a by-clause (field). The aggregation part of the command has multiple options to choose from while the by-clause or field is optional.
|stats <aggregation> BY <field>

<aggregation> = count, avg(), max(), sum()
How to Use the STATS Command
Step 1: Find your data.
For this example, we’re using event log data.
Step 2: Run a STATS count.
|stats <count>
In this command, <count> is the aggregation. It applies to all the information in the event log data we pulled in step one.
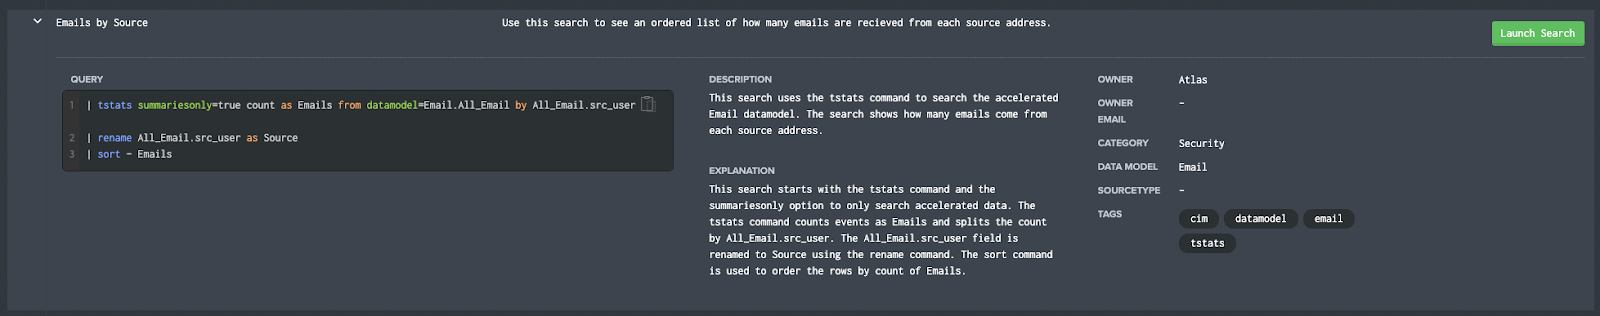
Splunk Pro Tip: There’s a super simple way to run searches simply—even with limited knowledge of SPL— using Search Library in the Atlas app on Splunkbase. You’ll get access to thousands of pre-configured Splunk searches developed by Splunk Experts across the globe. Simply find a search string that matches what you’re looking for, copy it, and use right in your own Splunk environment. Try speeding up your tsats search right now using these SPL templates, completely free.
Run a pre-Configured Search for Free
STATS Use Cases
Let’s take a look at a couple of use cases:
Use Case #1: You want to look at the number of failed login attempts.
index=_audit action="login attempt" info=failed | stats count by user

Use Case #2: You want to identify values like average, shortest, and the longest runtime on saved searches.
index=_internal sourcetype="scheduler" search_type=scheduled | stats avg(run_time) min(run_time) max(run_time)

STATS Tips and Tricks
So you can use the STATS command to find calculations and perform investigations, but you can enhance it to make it more readable or increase discovery in your environment.
Use the ‘as’ subcommand to rename fields in the STATS command. This will enable you to create specific tables without making further tweaks.
index=_internal sourcetype="scheduler" search_type=scheduled | stats avg(run_time) as AVGRUNTIME min(run_time) as MINRUNTIME max(run_time) as MAXRUNTIME
Use the ‘values’ aggregator to list all unique values found in the field. This can help discover the full range of not just numbers, but words found in the field. This can show differences more clearly.
index=_audit info=failed | stats values(action) as actions by user
STATS Results
STATS can help provide a strong overview of the activity within your environment. While STATS is a fairly simple command it can provide huge insights into your data. When paired with other commands like iplocation or lookup you can enrich your data to find anomalies such as interactions from certain countries or blacklisted IP addresses.
If you found this helpful…
You don’t have to master Splunk by yourself in order to get the most value out of it. Small, day-to-day optimizations of your environment can make all the difference in how you understand and use the data in your Splunk environment to manage all the work on your plate.
Cue Atlas Assessment 30-day free trial: a customized report to show you where your Splunk environment is excelling and opportunities for improvement. You’ll get your report in just 30 minutes.